%matplotlib inlineimport numpy as npimport pandas as pdimport seaborn as snsimport scviimport scanpy as scimport cellrank as crimport matplotlib.pyplot as pltfrom sklearn.preprocessing import MinMaxScalerimport scvelo as scvscv.set_figure_params('scvelo')import warningswarnings.simplefilter("ignore", category=UserWarning)
/home/fdb589/projects/data/Brickman/conda/envs/scvi-1.0.0/lib/python3.10/site-packages/scvi/_settings.py:63: UserWarning: Since v1.0.0, scvi-tools no longer uses a random seed by default. Run `scvi.settings.seed = 0` to reproduce results from previous versions.
  self.seed = seed
/home/fdb589/projects/data/Brickman/conda/envs/scvi-1.0.0/lib/python3.10/site-packages/scvi/_settings.py:70: UserWarning: Setting `dl_pin_memory_gpu_training` is deprecated in v1.0 and will be removed in v1.1. Please pass in `pin_memory` to the data loaders instead.
  self.dl_pin_memory_gpu_training = (
WARNING: transitions_confidence not found, using connectivites instead.
WARNING: Invalid color key. Using grey instead.
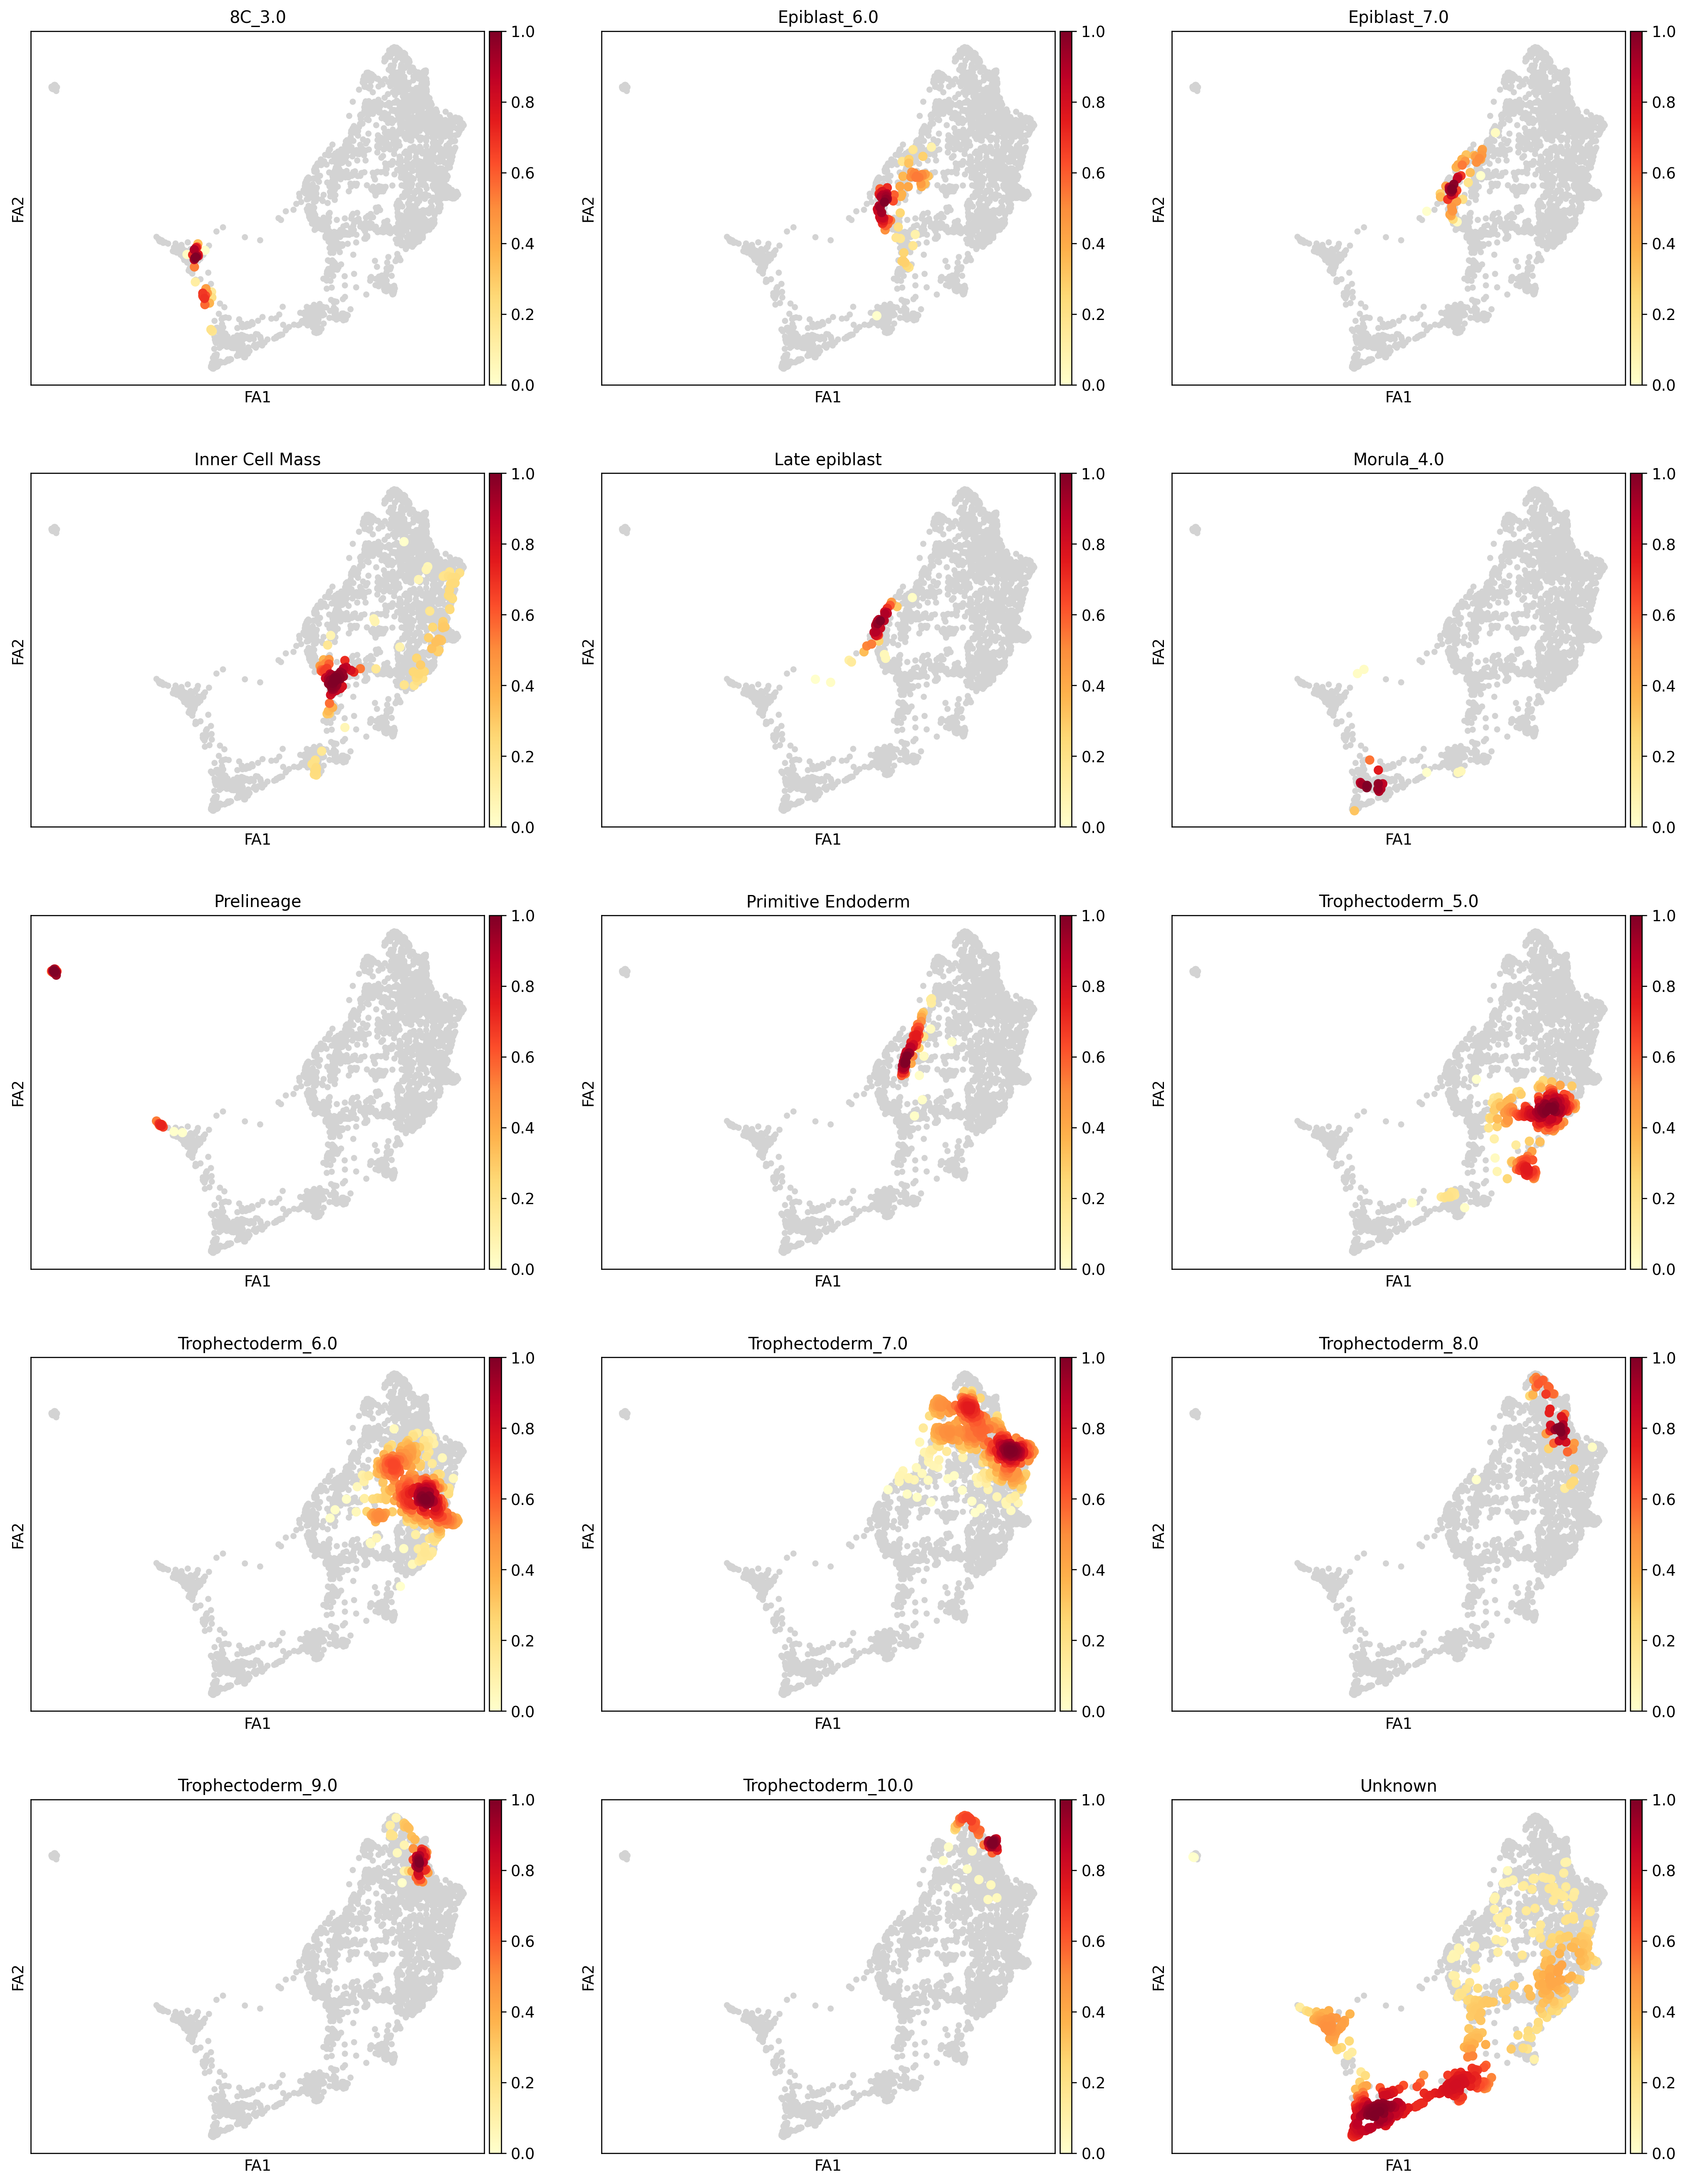
saving figure to file ../figures/human/scvelo_ct.svg
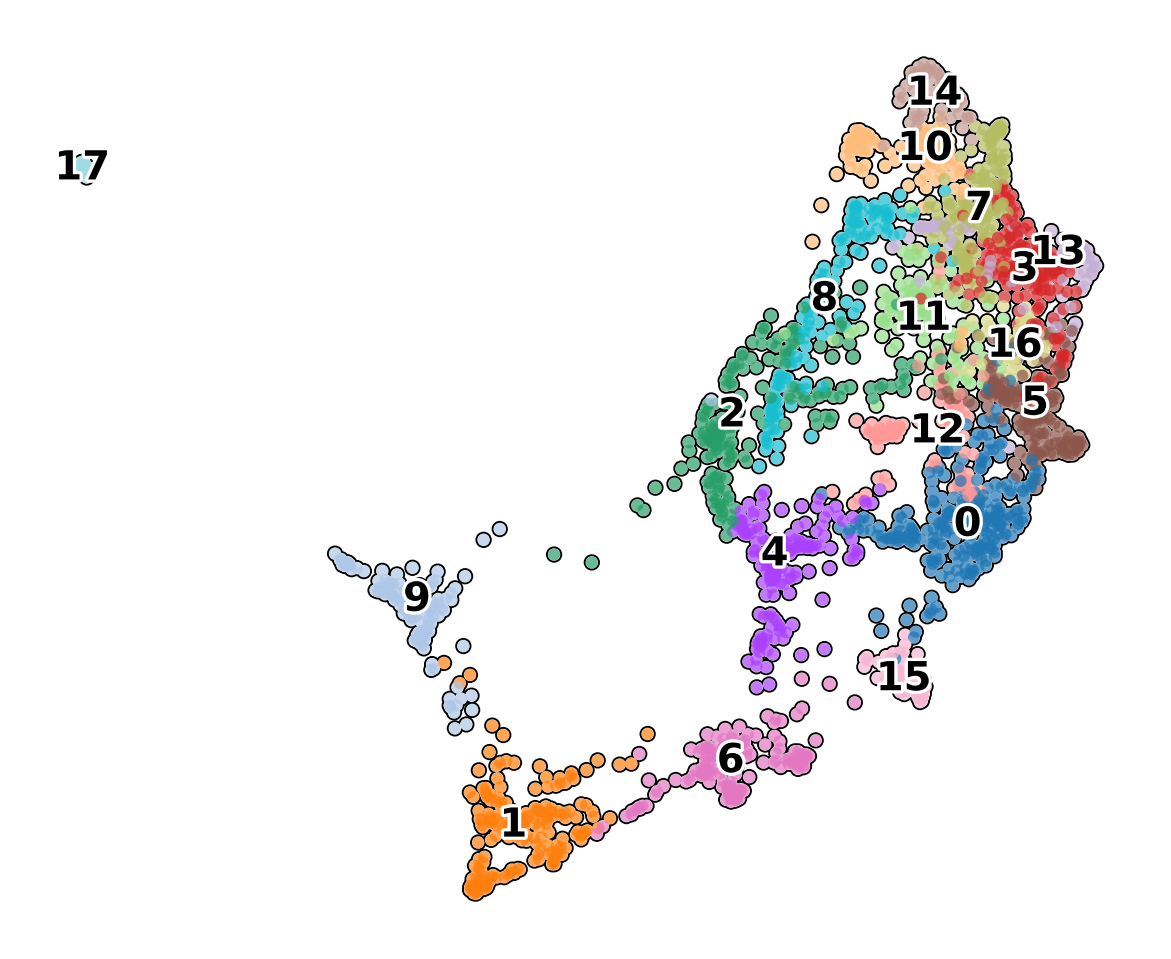
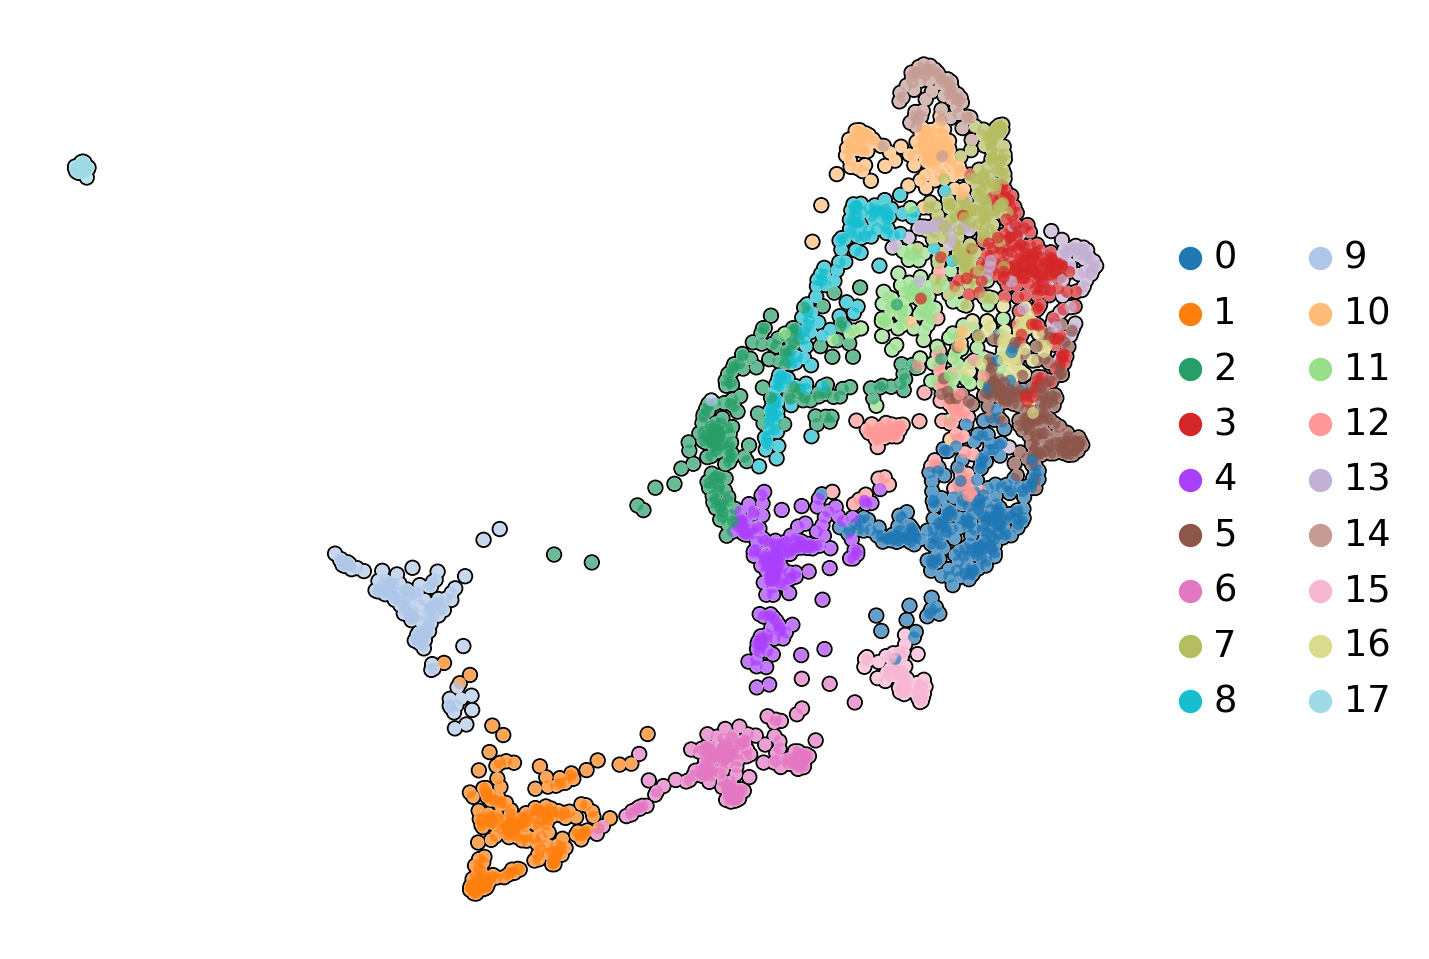
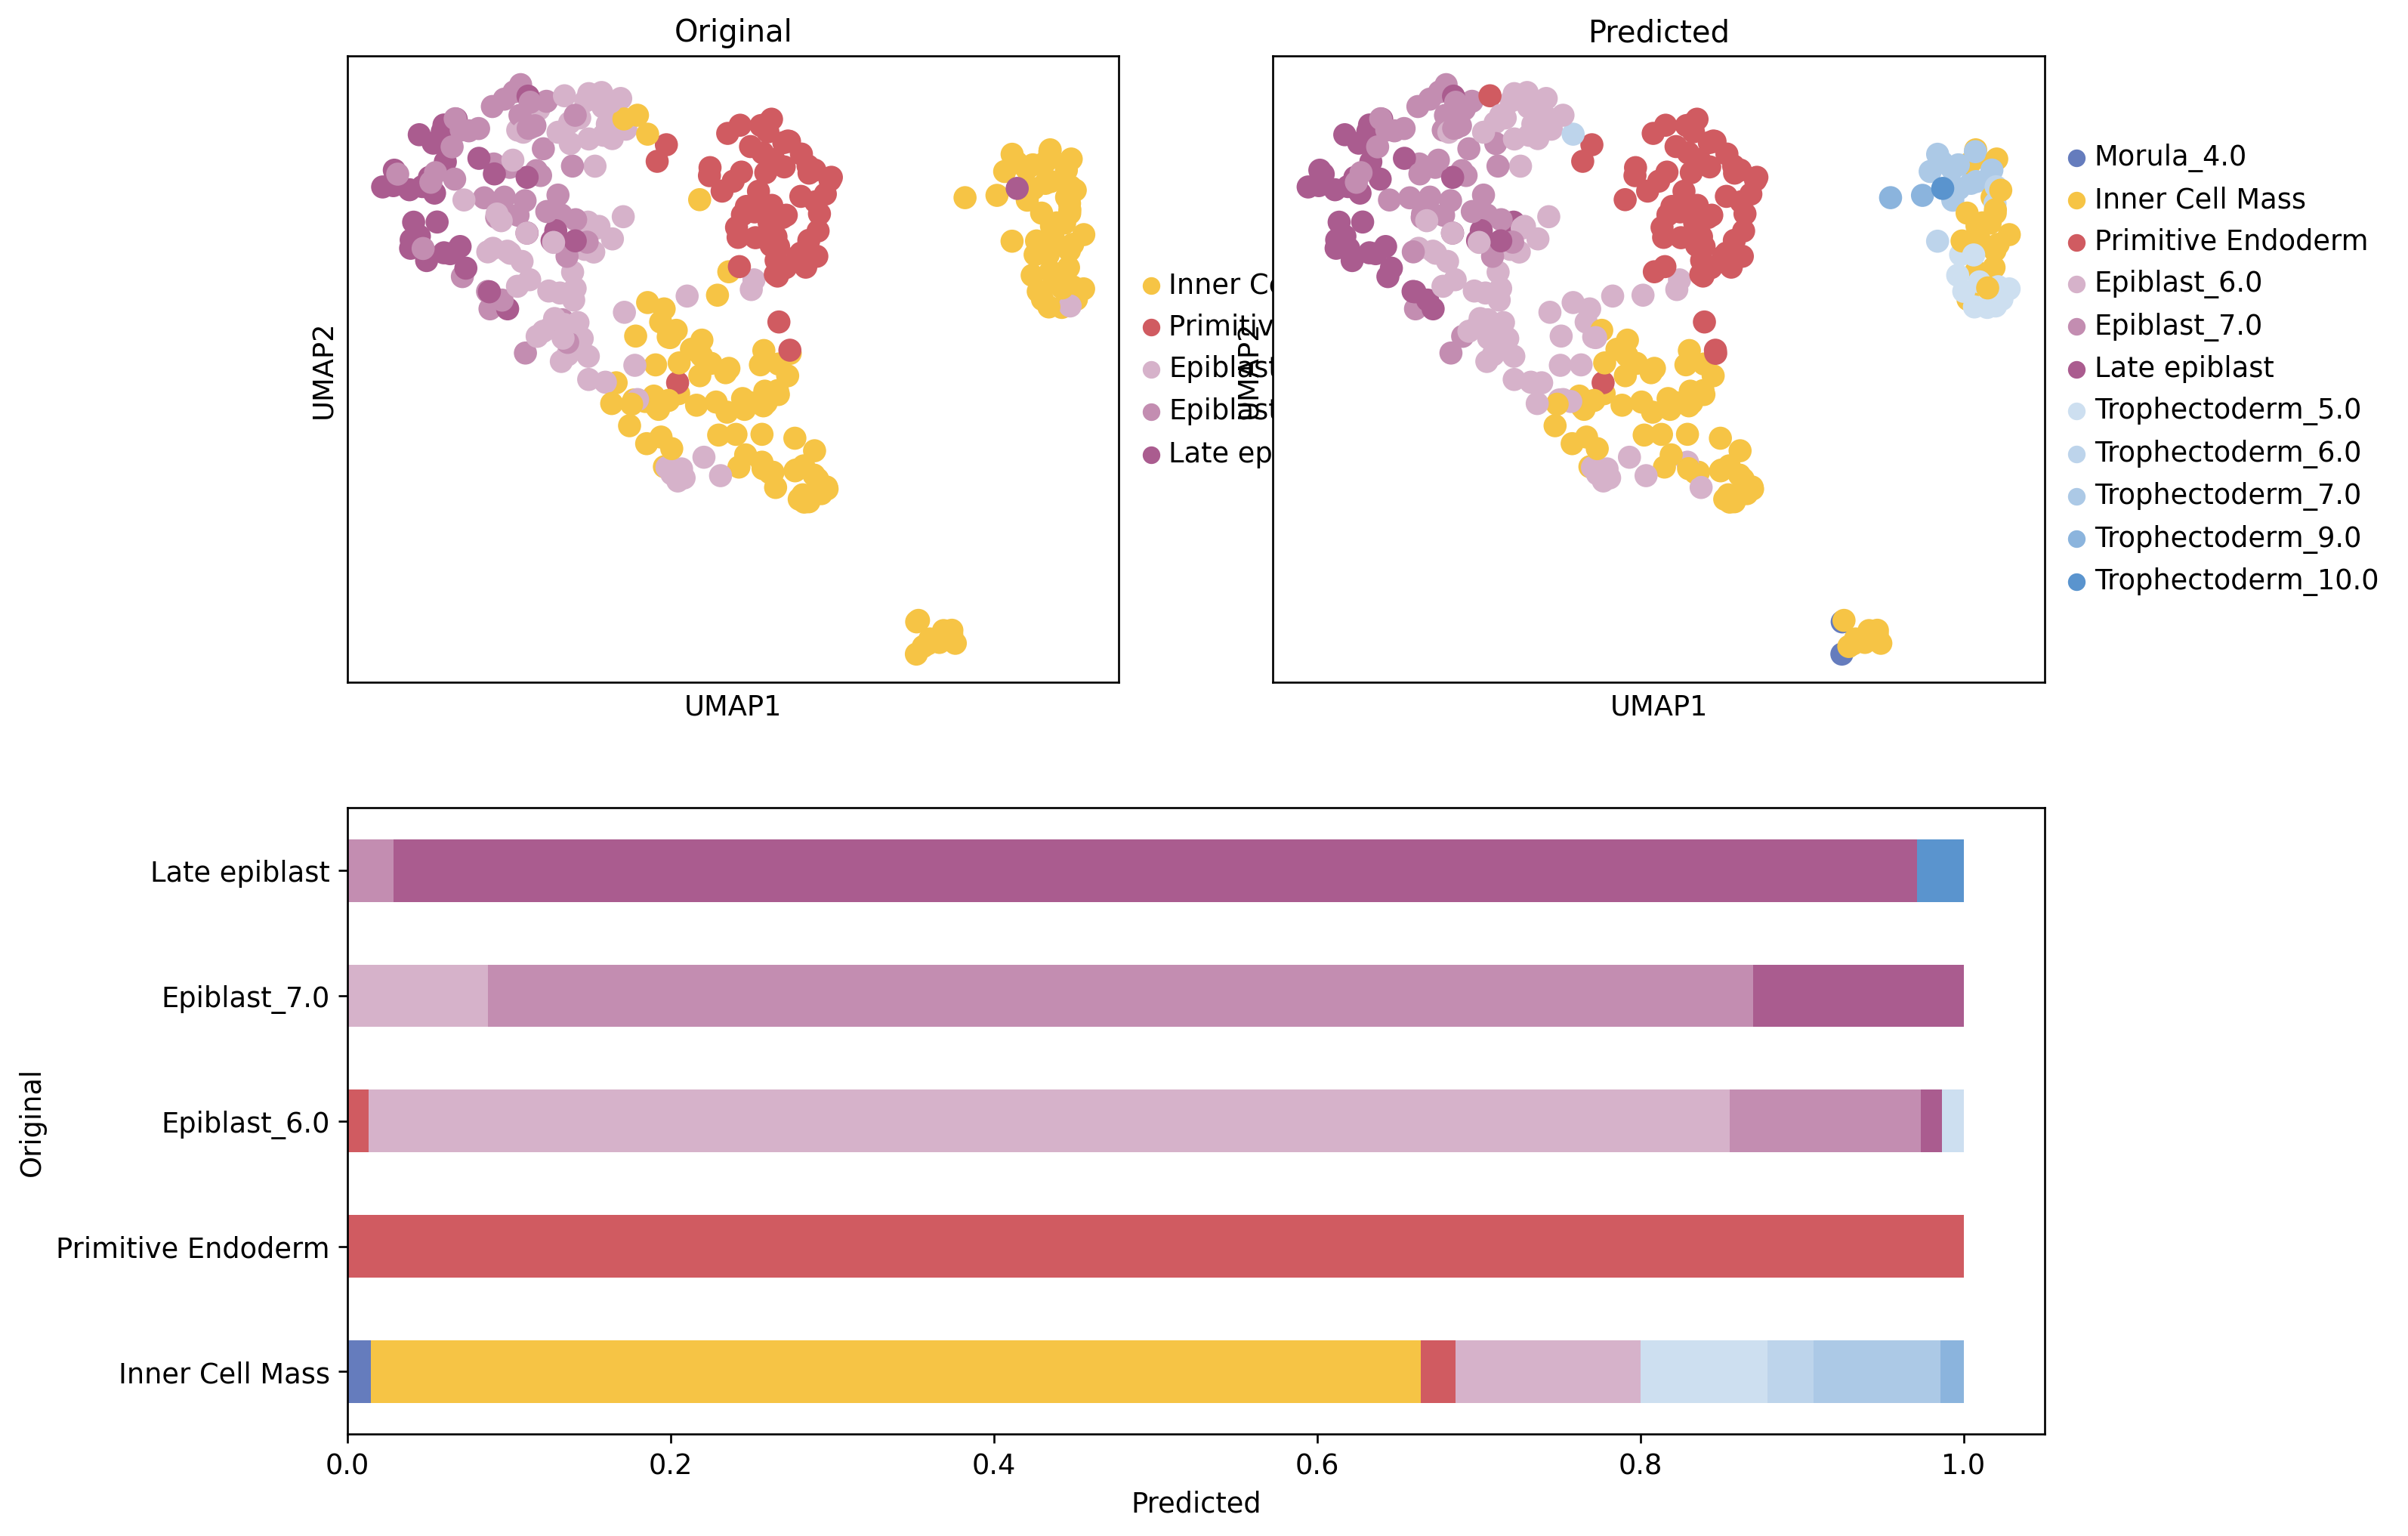
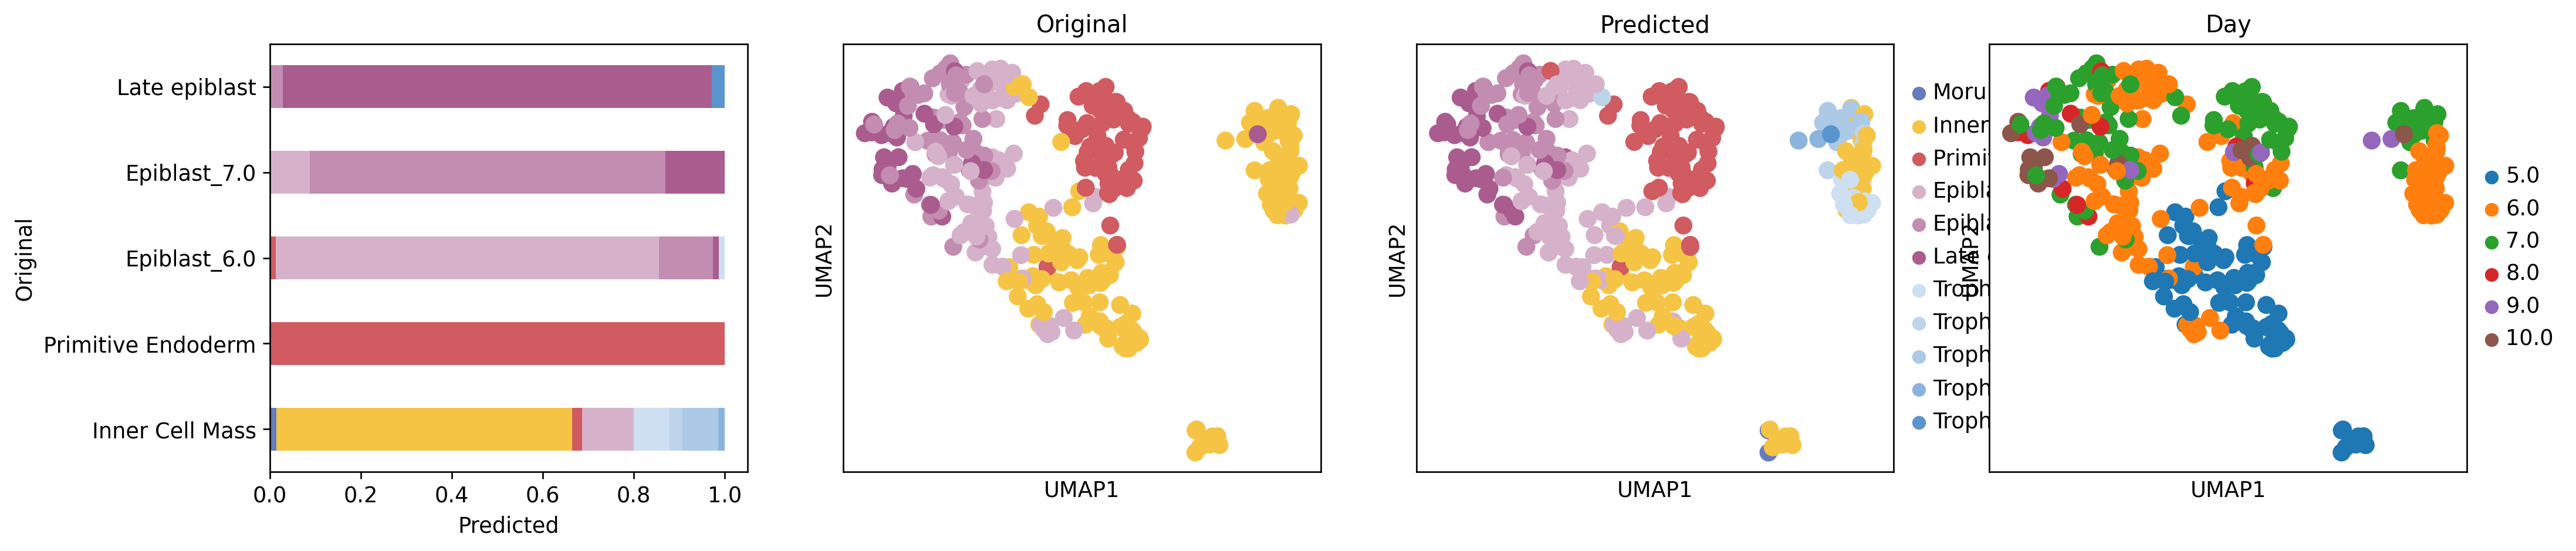
icm_adata = human_adata[human_adata.obs['ct_orig'].isin(['Inner Cell Mass', 'Primitive Endoderm', 'Epiblast'])].copy()icm_adata.uns['ct_fine_colors'] = [ct_colors[x] for x in icm_adata.obs.ct_fine.cat.categories]icm_adata.uns['C_scANVI_nsamples_colors'] = [ct_colors[x] for x in icm_adata.obs.C_scANVI_nsamples.cat.categories]sc.tl.pca(icm_adata, svd_solver='arpack')sc.pp.neighbors(icm_adata, use_rep='X_scVI')sc.tl.umap(icm_adata)sc.tl.leiden(icm_adata)
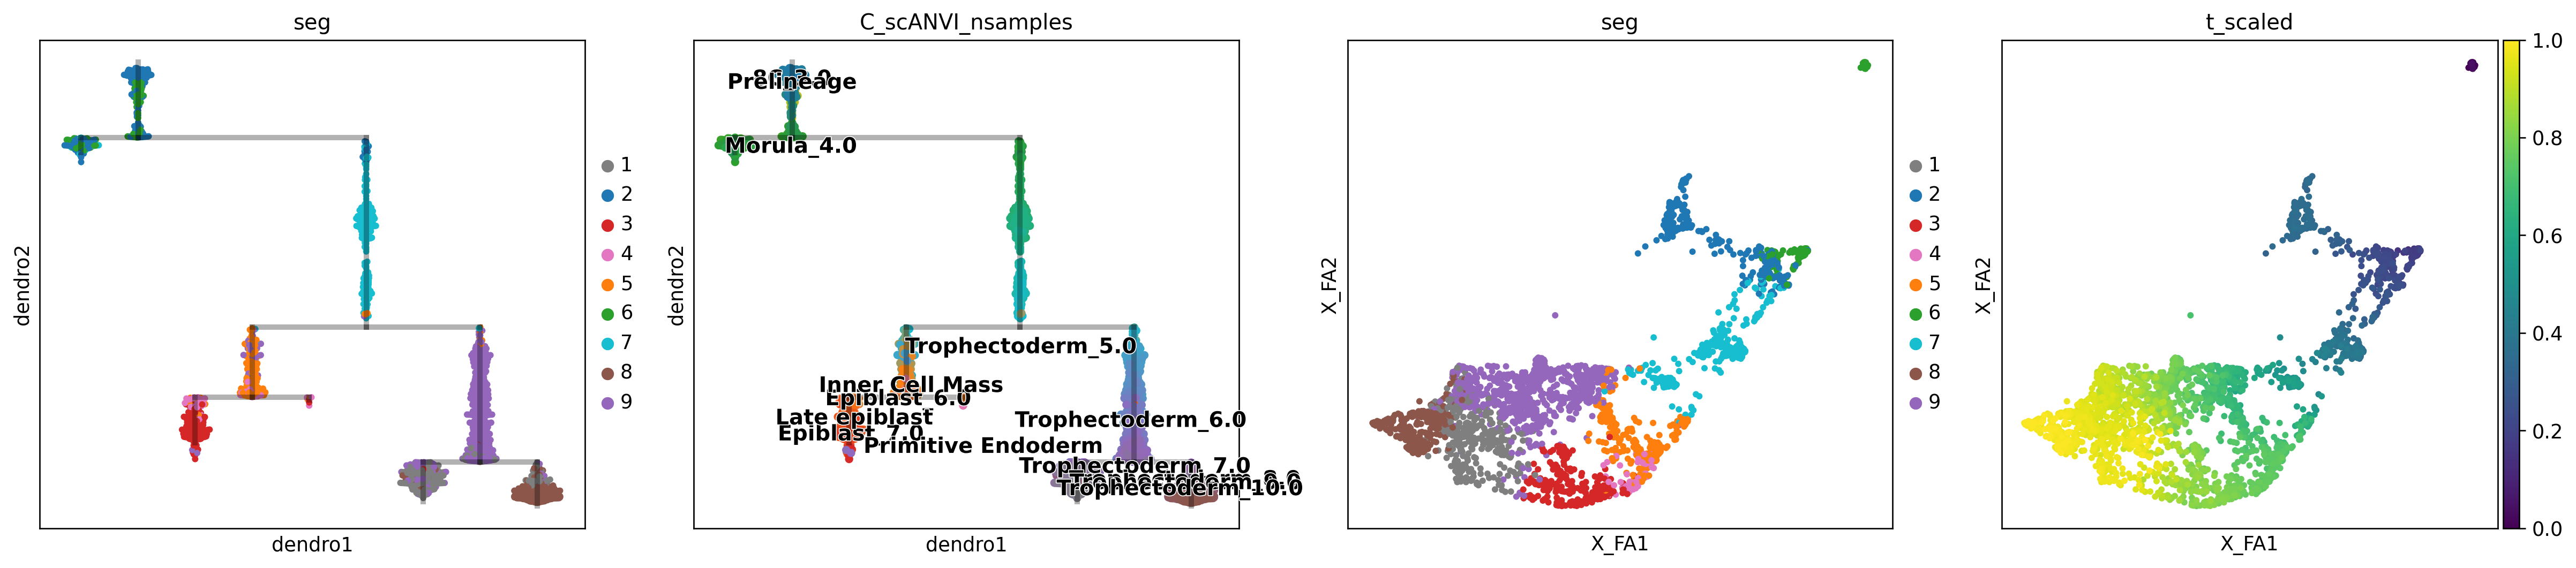
human_scfates = human.copy()human_scfates.obs['C_scANVI_nsamples'] = scvi.model.SCANVI.load("../results/02_human_integration/05_scanvi_ns15/").adata.obs.C_scANVI_nsampleshuman_scfates.uns['C_scANVI_nsamples_colors'] = [ct_colors[x] for x in human_scfates.obs.C_scANVI_nsamples.cat.categories]
INFO File ../results/02_human_integration/05_scanvi_ns15/model.pt already downloaded
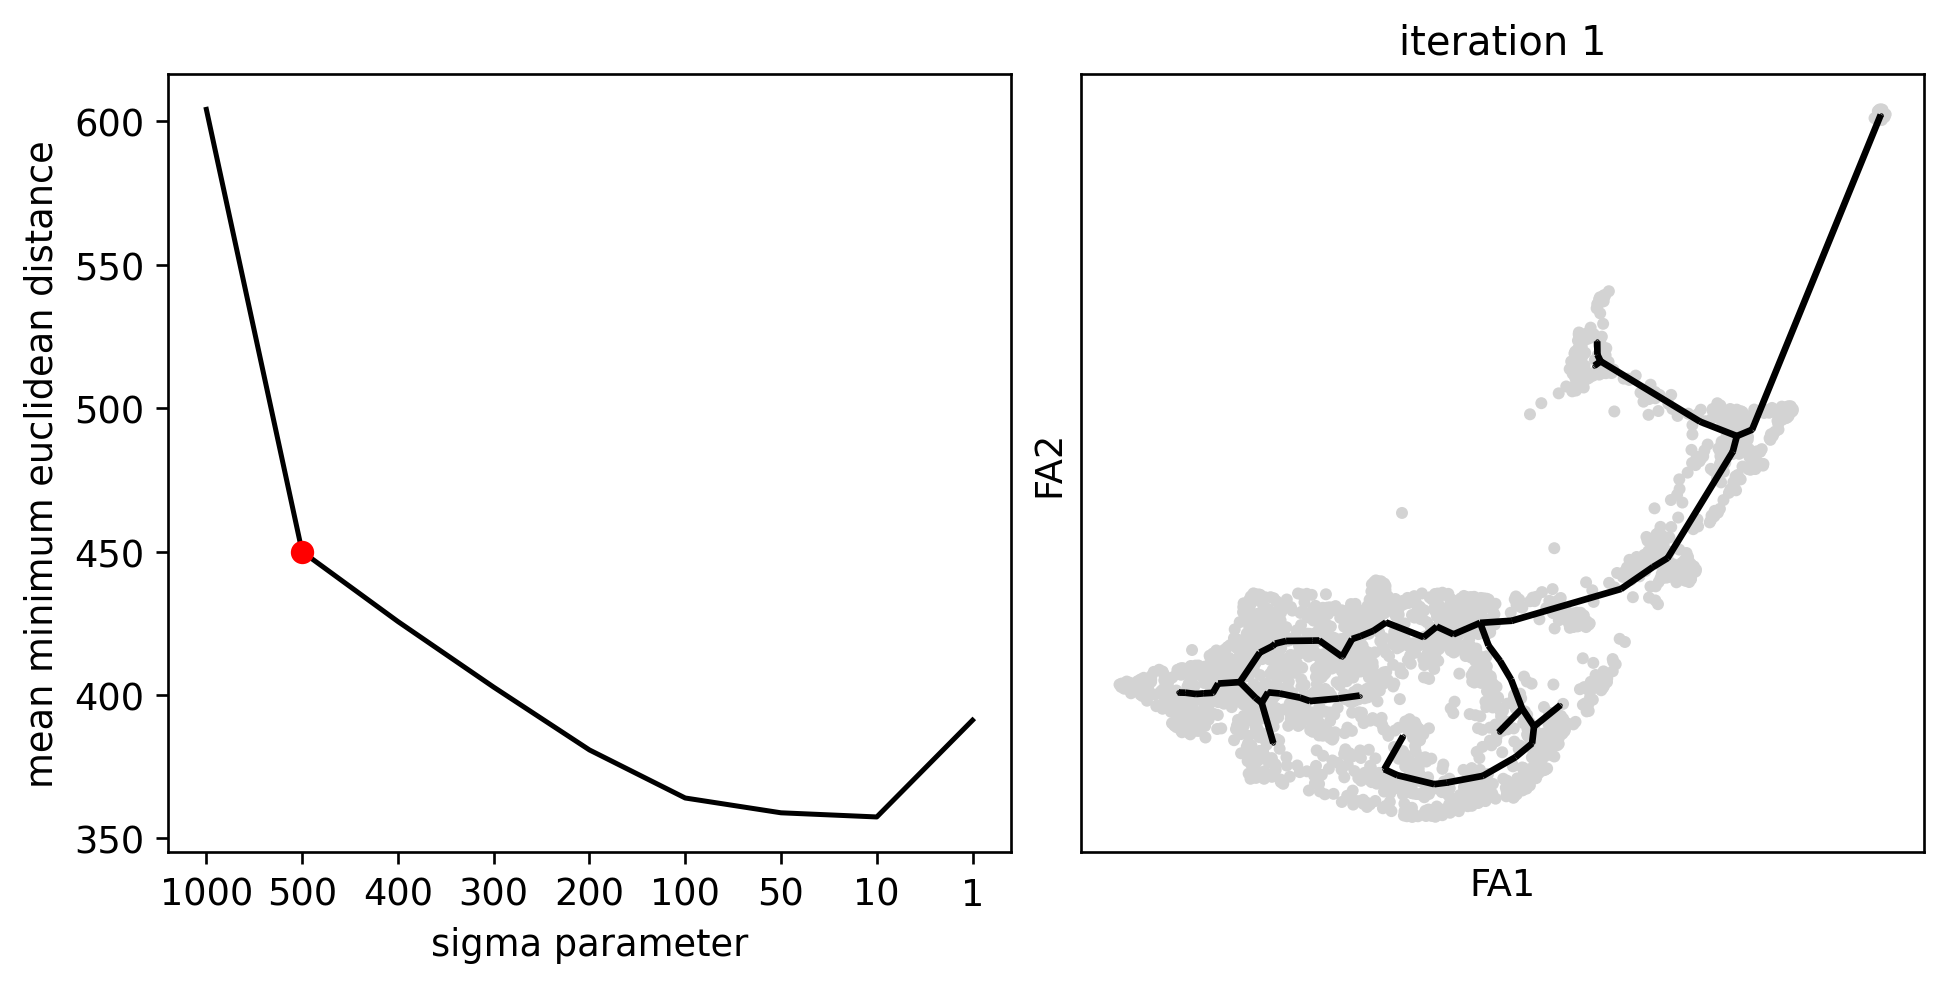
inferring a principal tree --> parameters used
    70 principal points, sigma = 500, lambda = 100, metric = euclidean
    fitting: 100%|████████████████████████████████████████████████████████████████████████████████████████████| 10/10 [00:00<00:00, 249.68it/s]
    not converged (error: 0.182933549445047)
    finished (0:00:00) --> added
    .uns['ppt'], dictionnary containing inferred tree.
    .obsm['X_R'] soft assignment of cells to principal points.
    .uns['graph']['B'] adjacency matrix of the principal points.
    .uns['graph']['F'] coordinates of principal points in representation space.
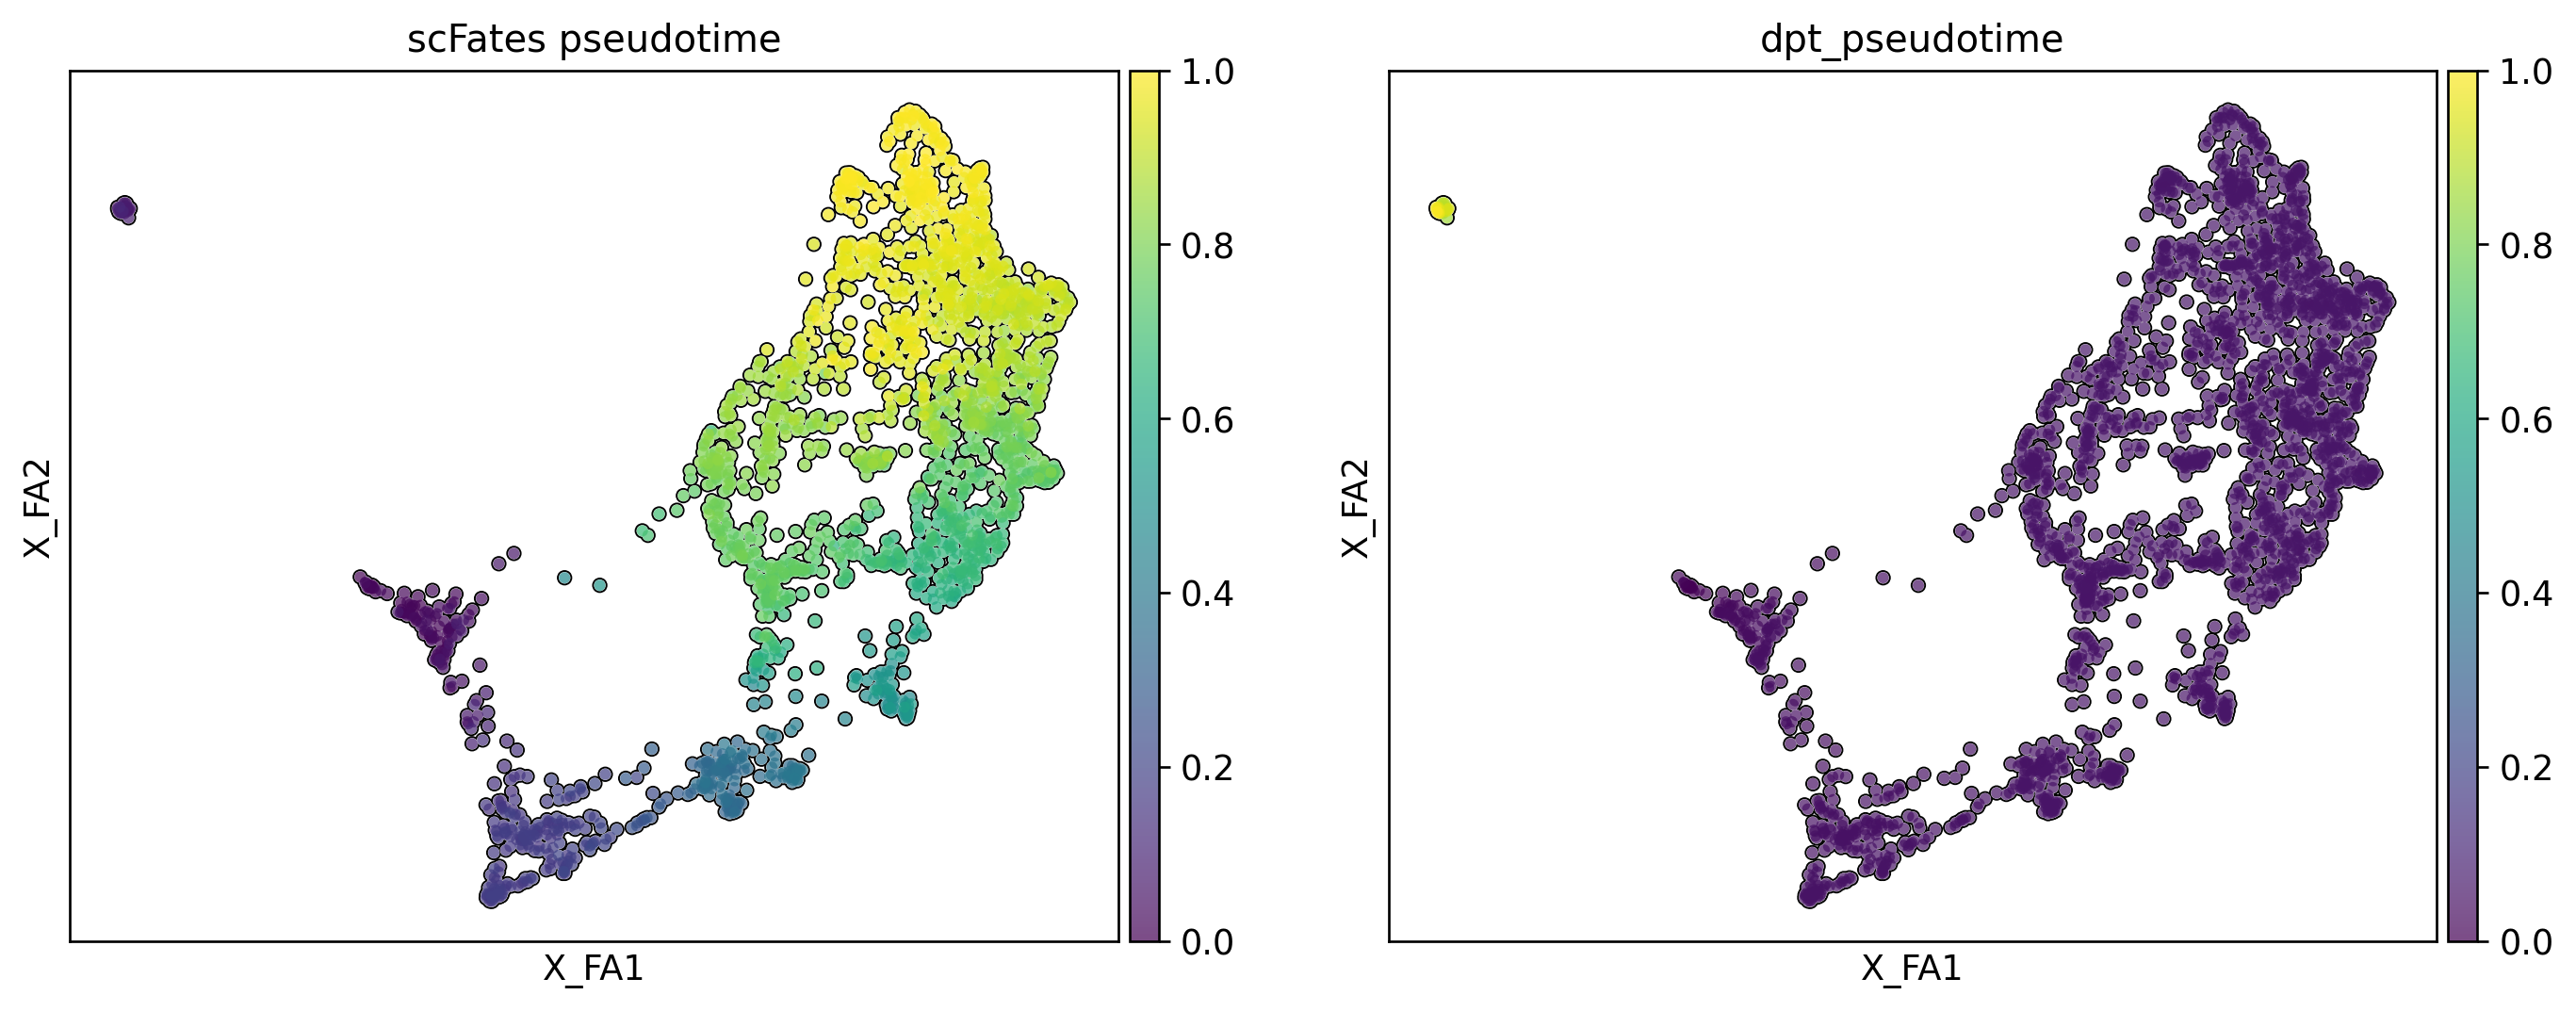
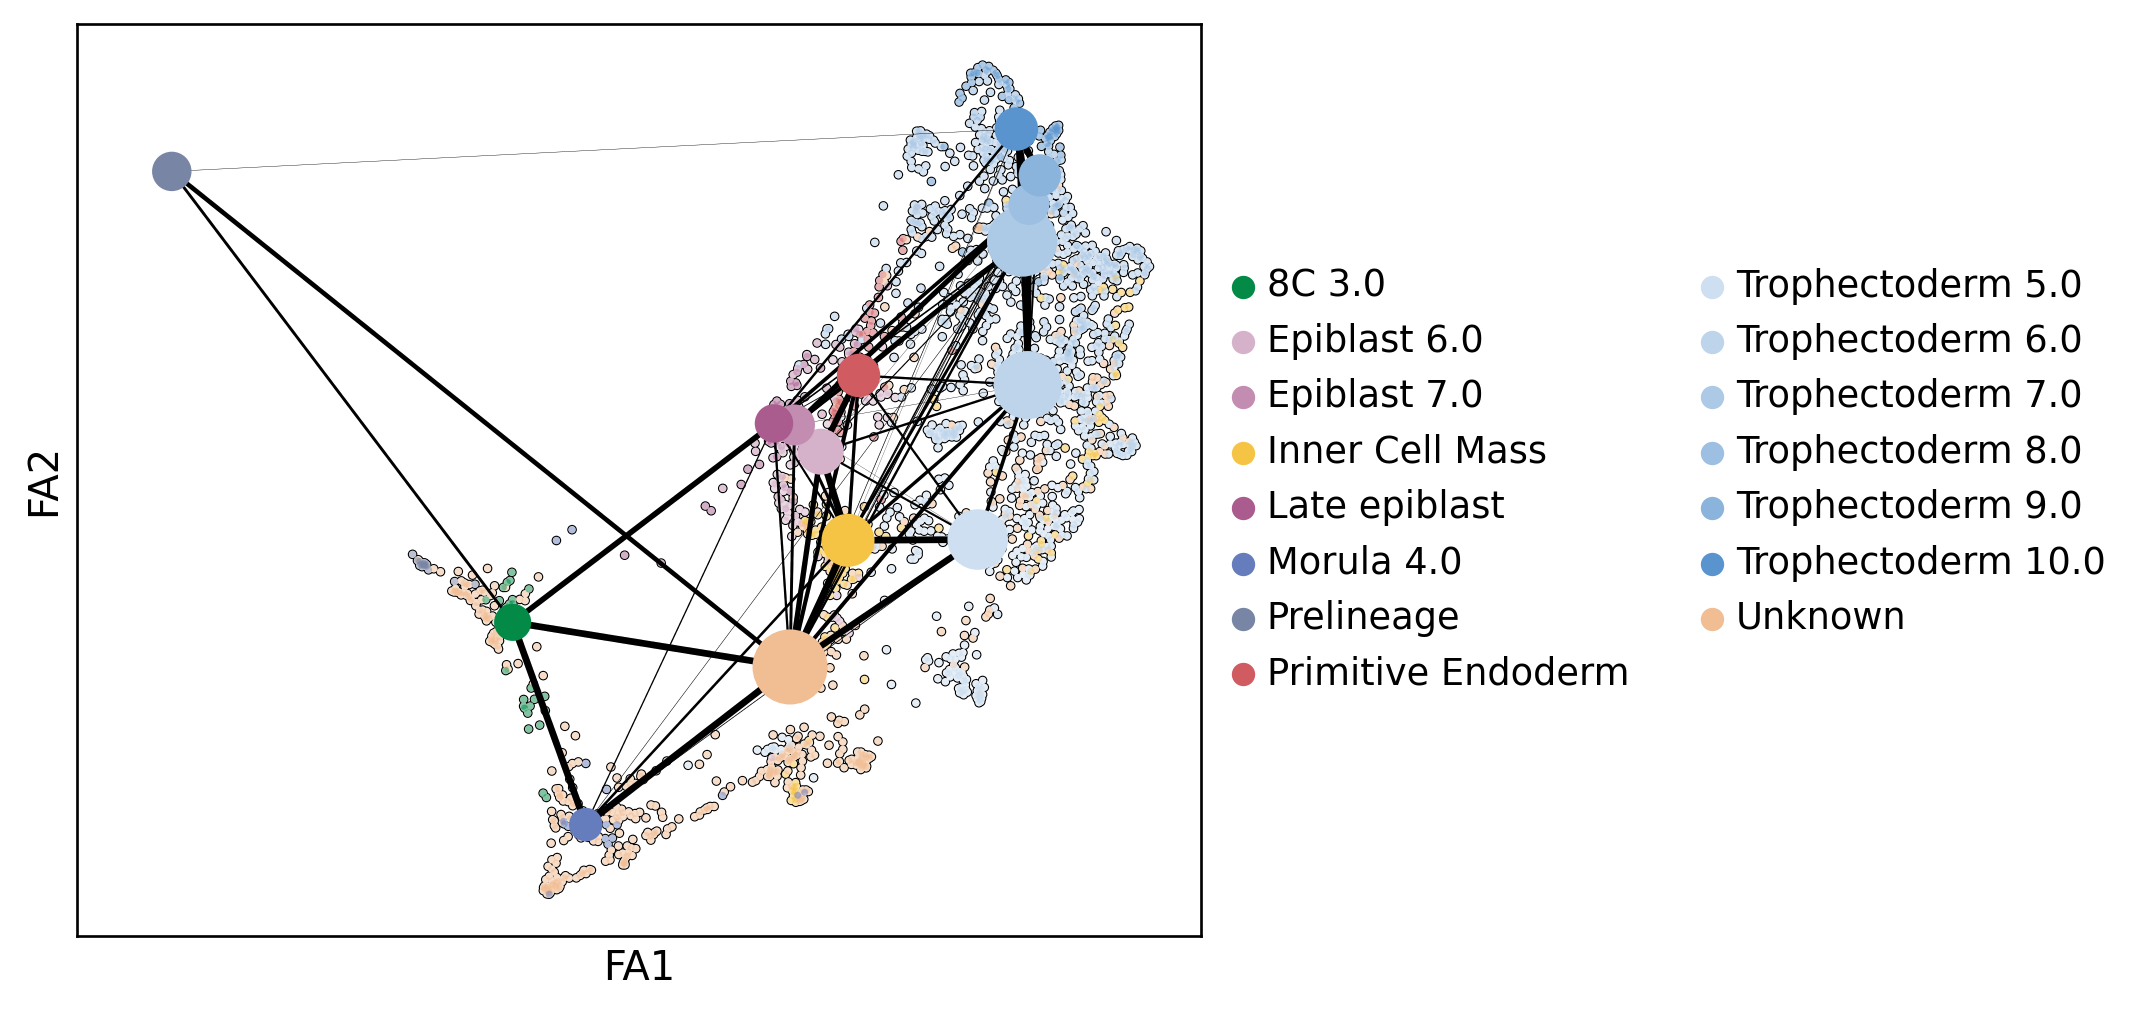
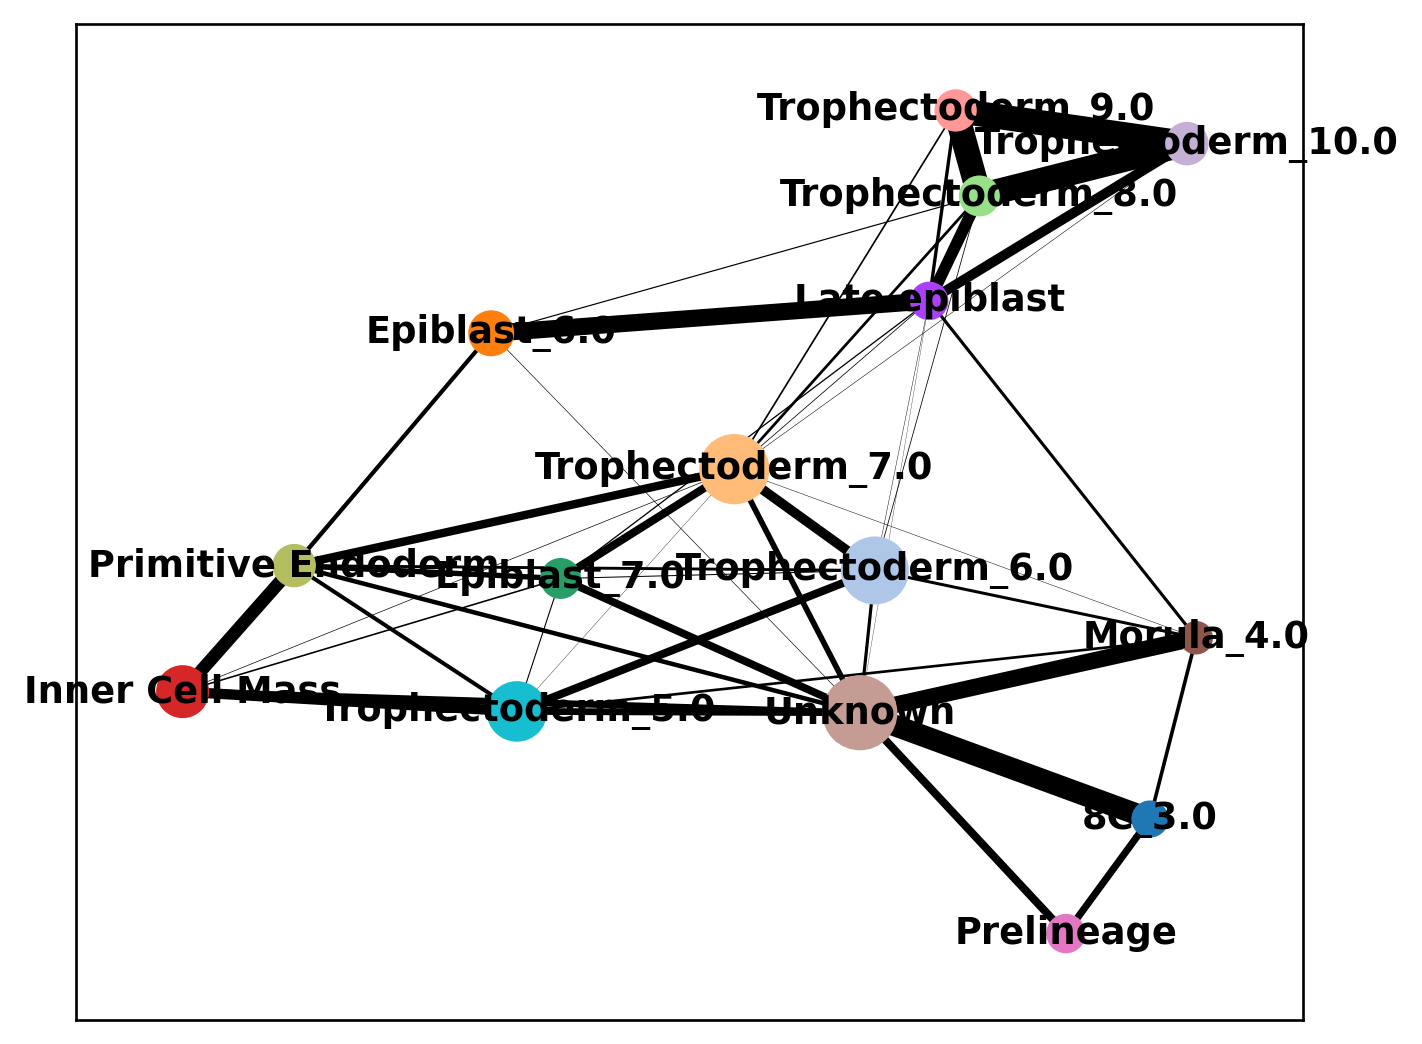
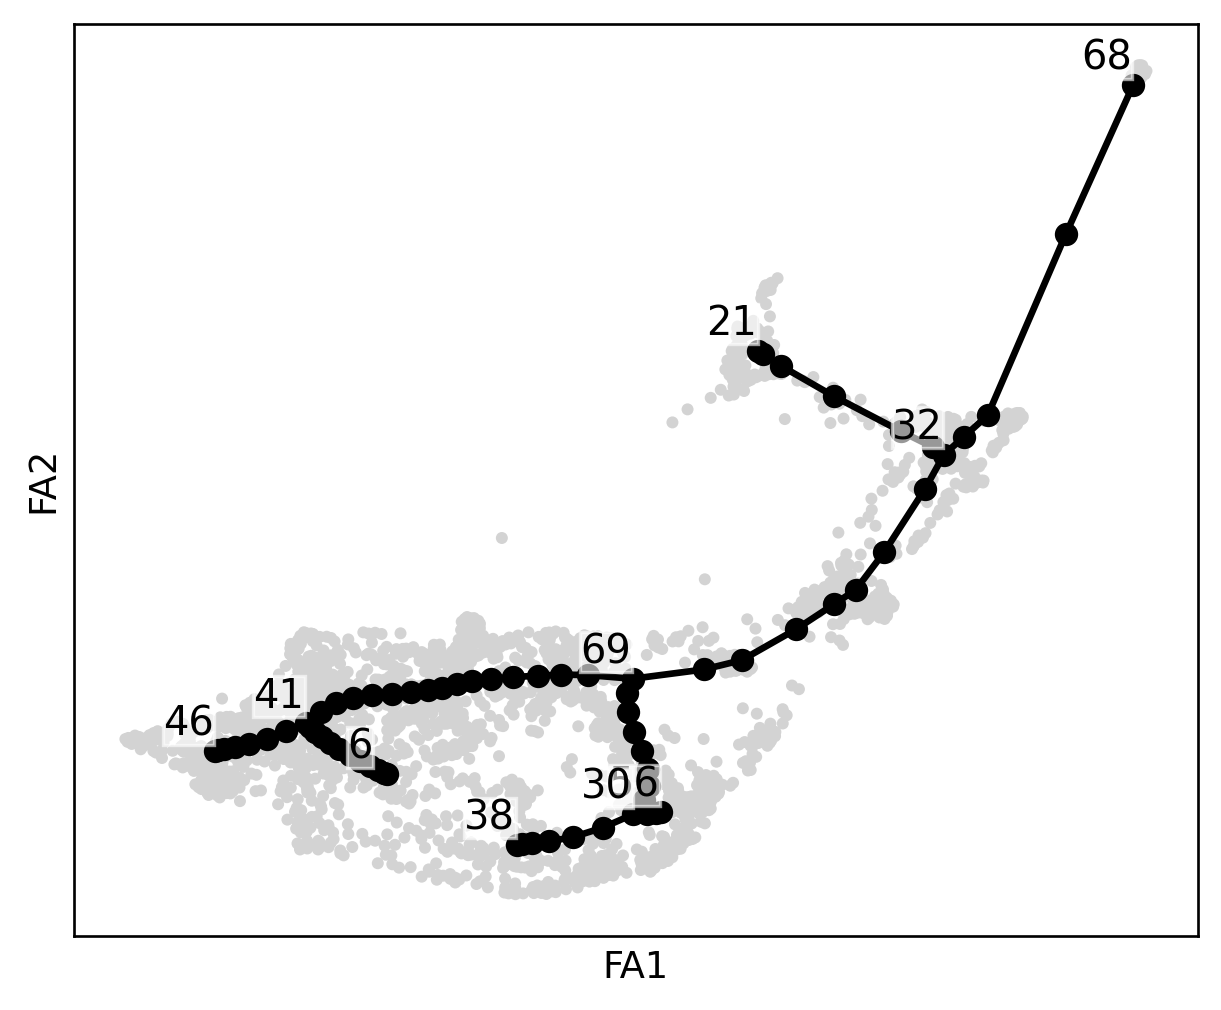
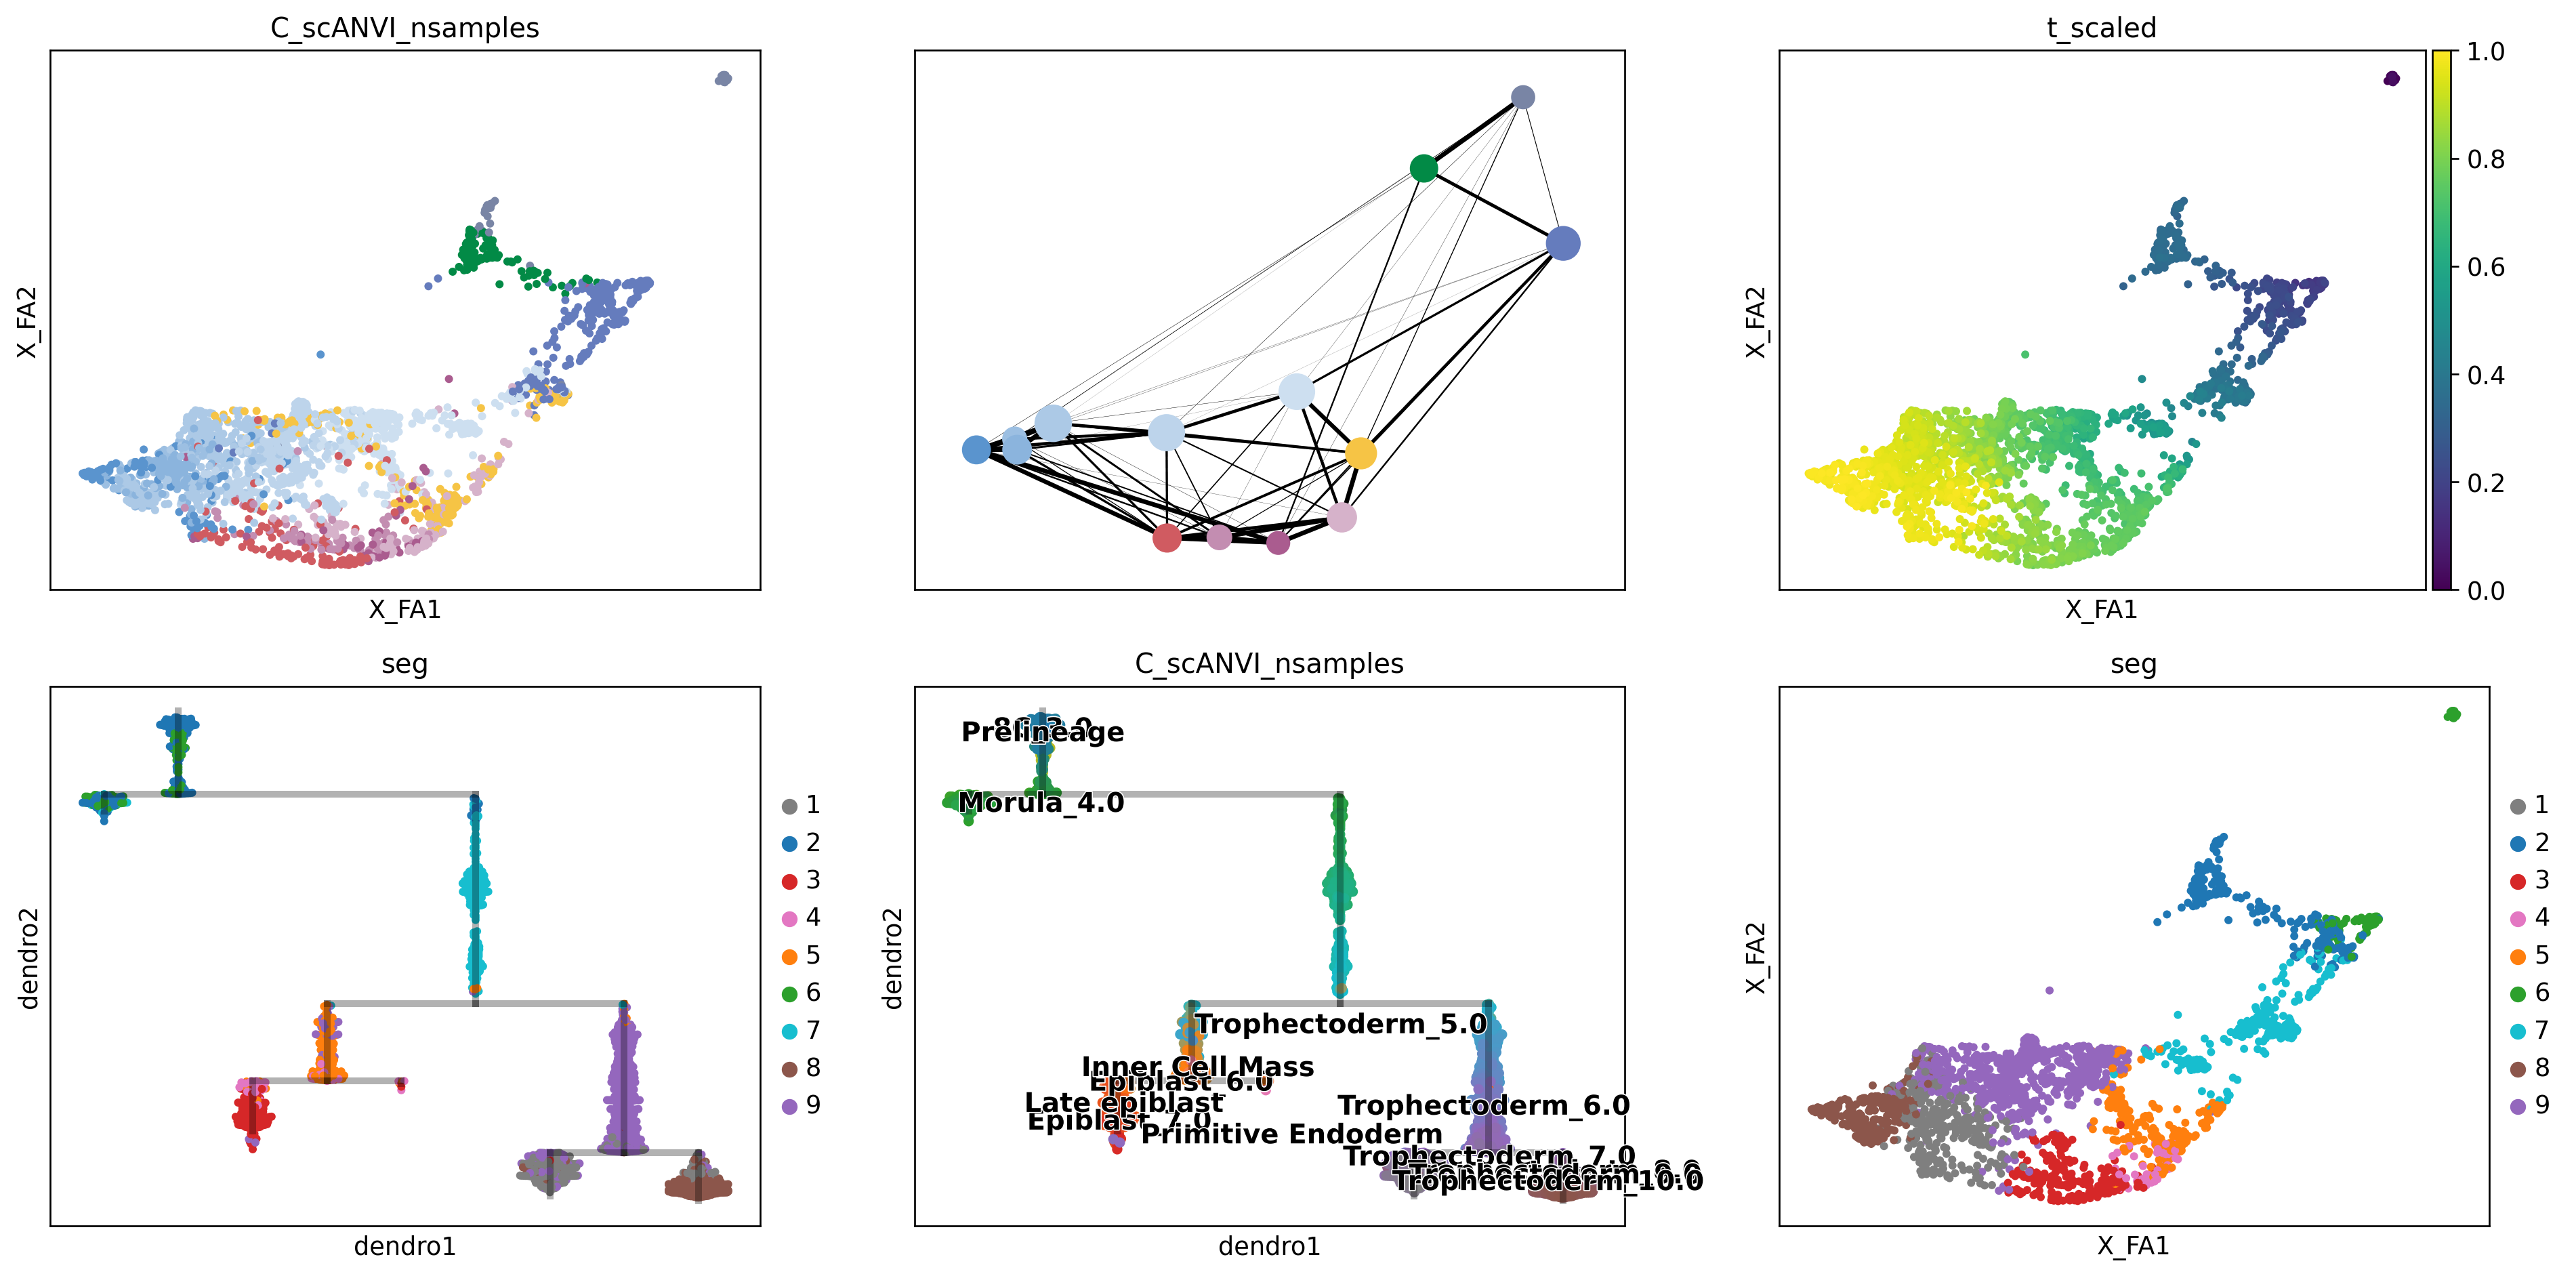
scf.pl.graph(human_scfates)
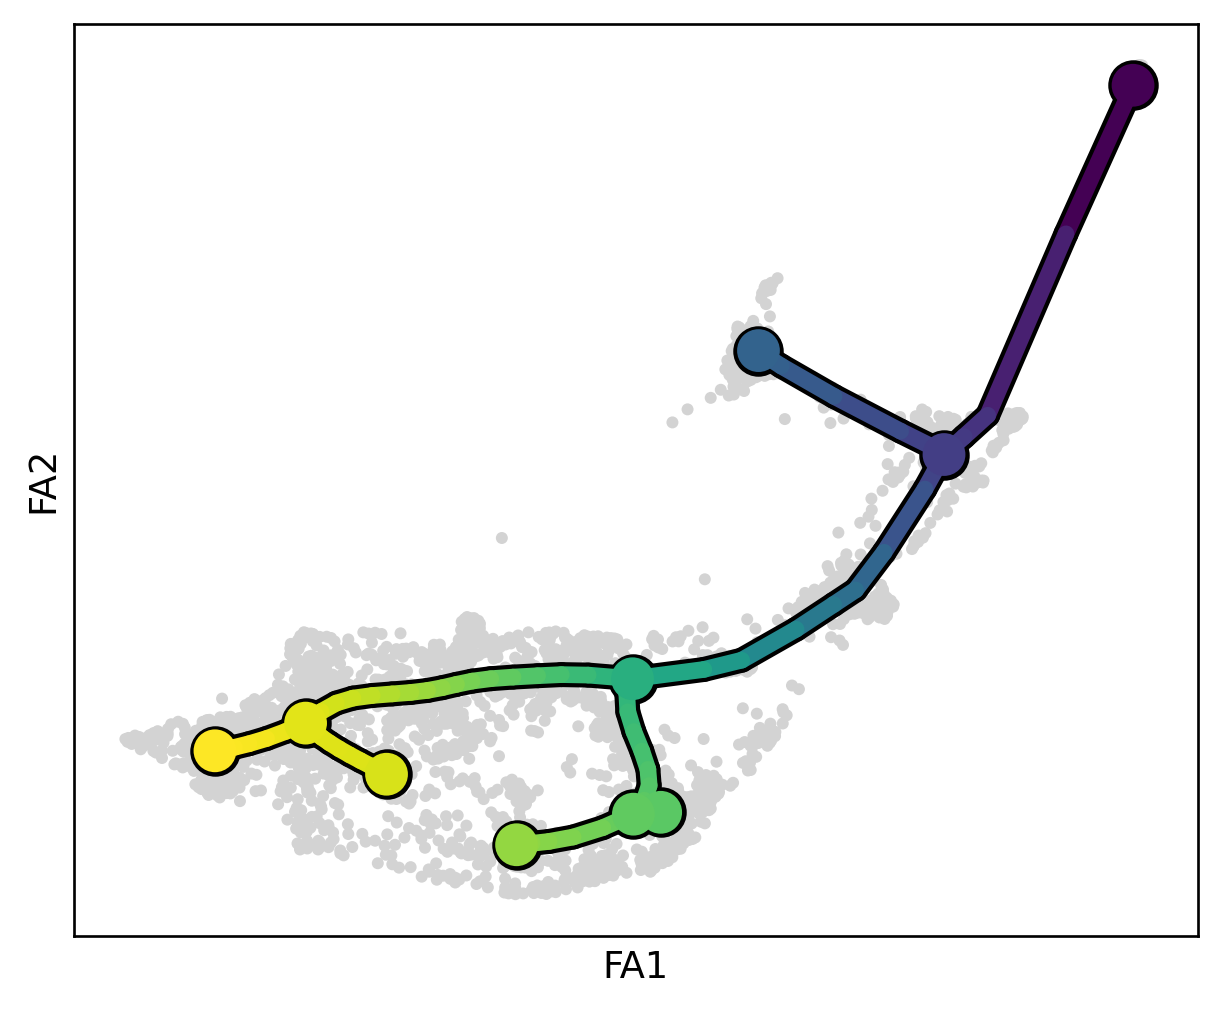
scf.tl.root(human_scfates, 68)
node 68 selected as a root --> added
    .uns['graph']['root'] selected root.
    .uns['graph']['pp_info'] for each PP, its distance vs root and segment assignment.
    .uns['graph']['pp_seg'] segments network information.
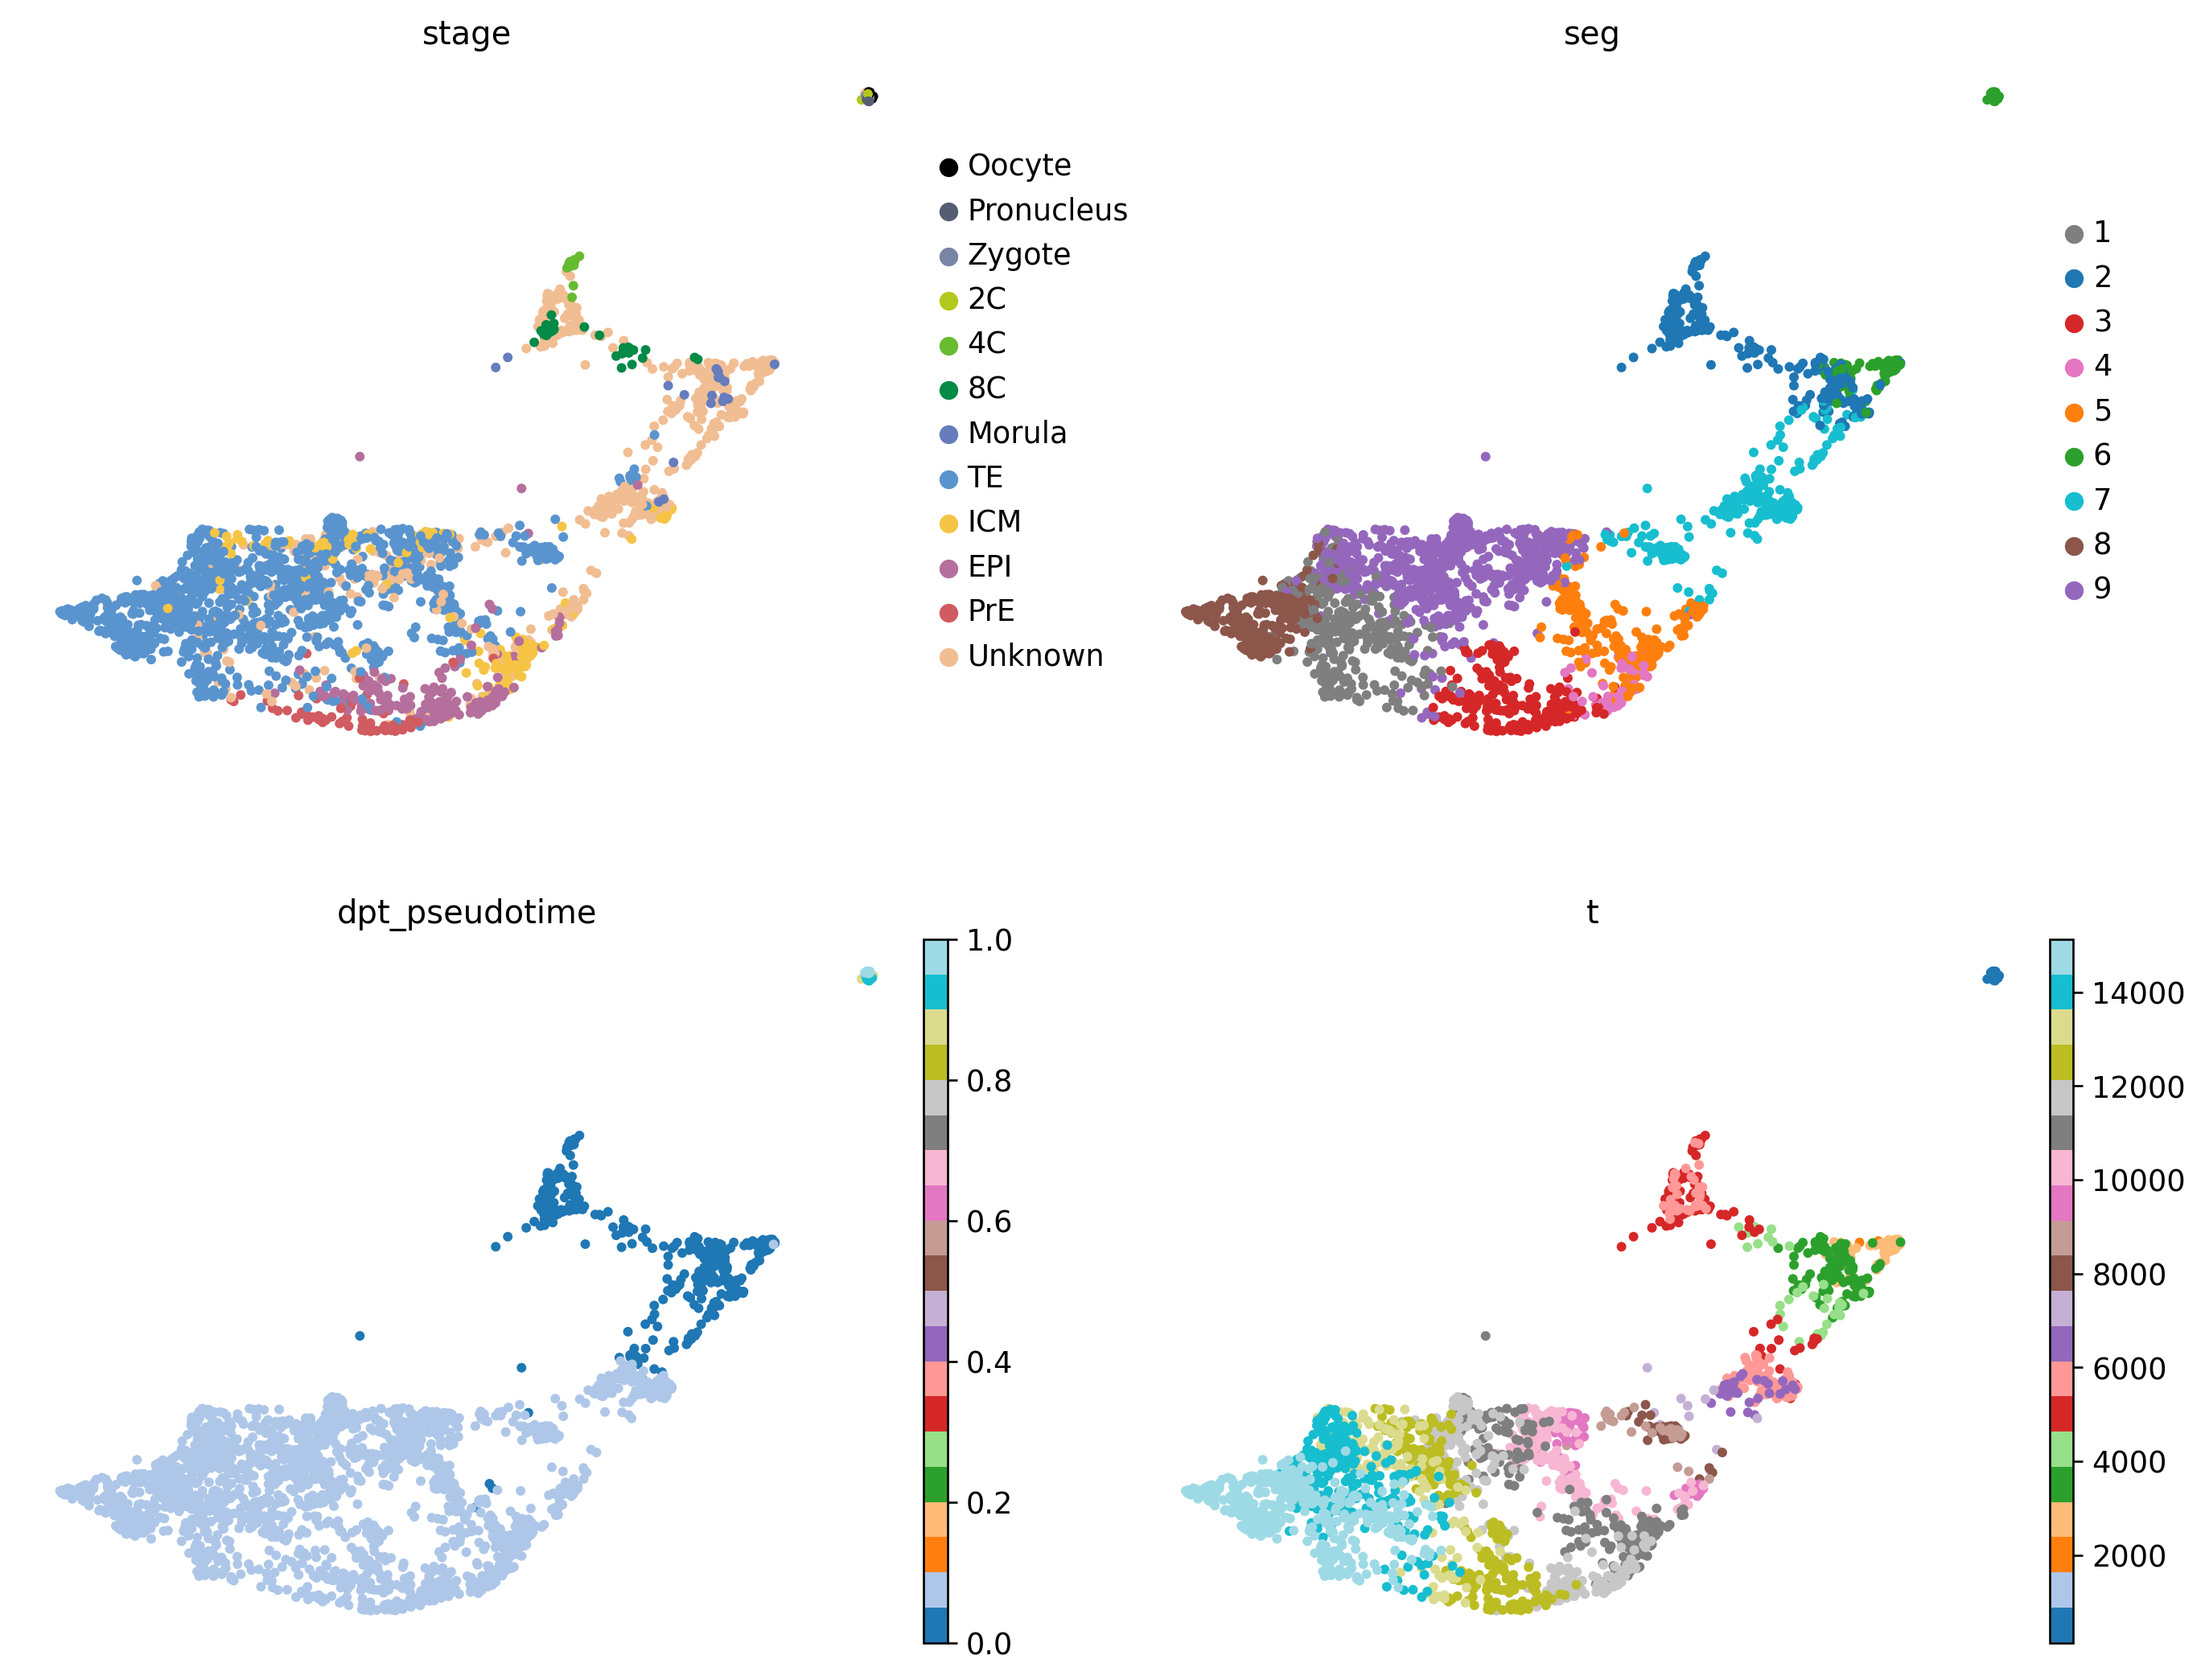
projecting cells onto the principal graph
    mappings: 100%|████████████████████████████████████████████████████████████████████████████████████████████| 10/10 [00:15<00:00,  1.53s/it]
    finished (0:00:16) --> added
    .obs['edge'] assigned edge.
    .obs['t'] pseudotime value.
    .obs['seg'] segment of the tree assigned.
    .obs['milestones'] milestone assigned.
    .uns['pseudotime_list'] list of cell projection from all mappings.
INFO     File ../results/02_human_integration/05_scanvi_ns15/model.pt already downloaded
INFO     Found 100.0% reference vars in query data.
INFO     Training for 100 epochs.
Epoch 100/100: 100%|█████████████████████████████| 100/100 [00:20<00:00,  5.47it/s, v_num=1, train_loss_step=4.71e+3, train_loss_epoch=4.74e+3]Epoch 100/100: 100%|█████████████████████████████| 100/100 [00:20<00:00,  4.80it/s, v_num=1, train_loss_step=4.71e+3, train_loss_epoch=4.74e+3]
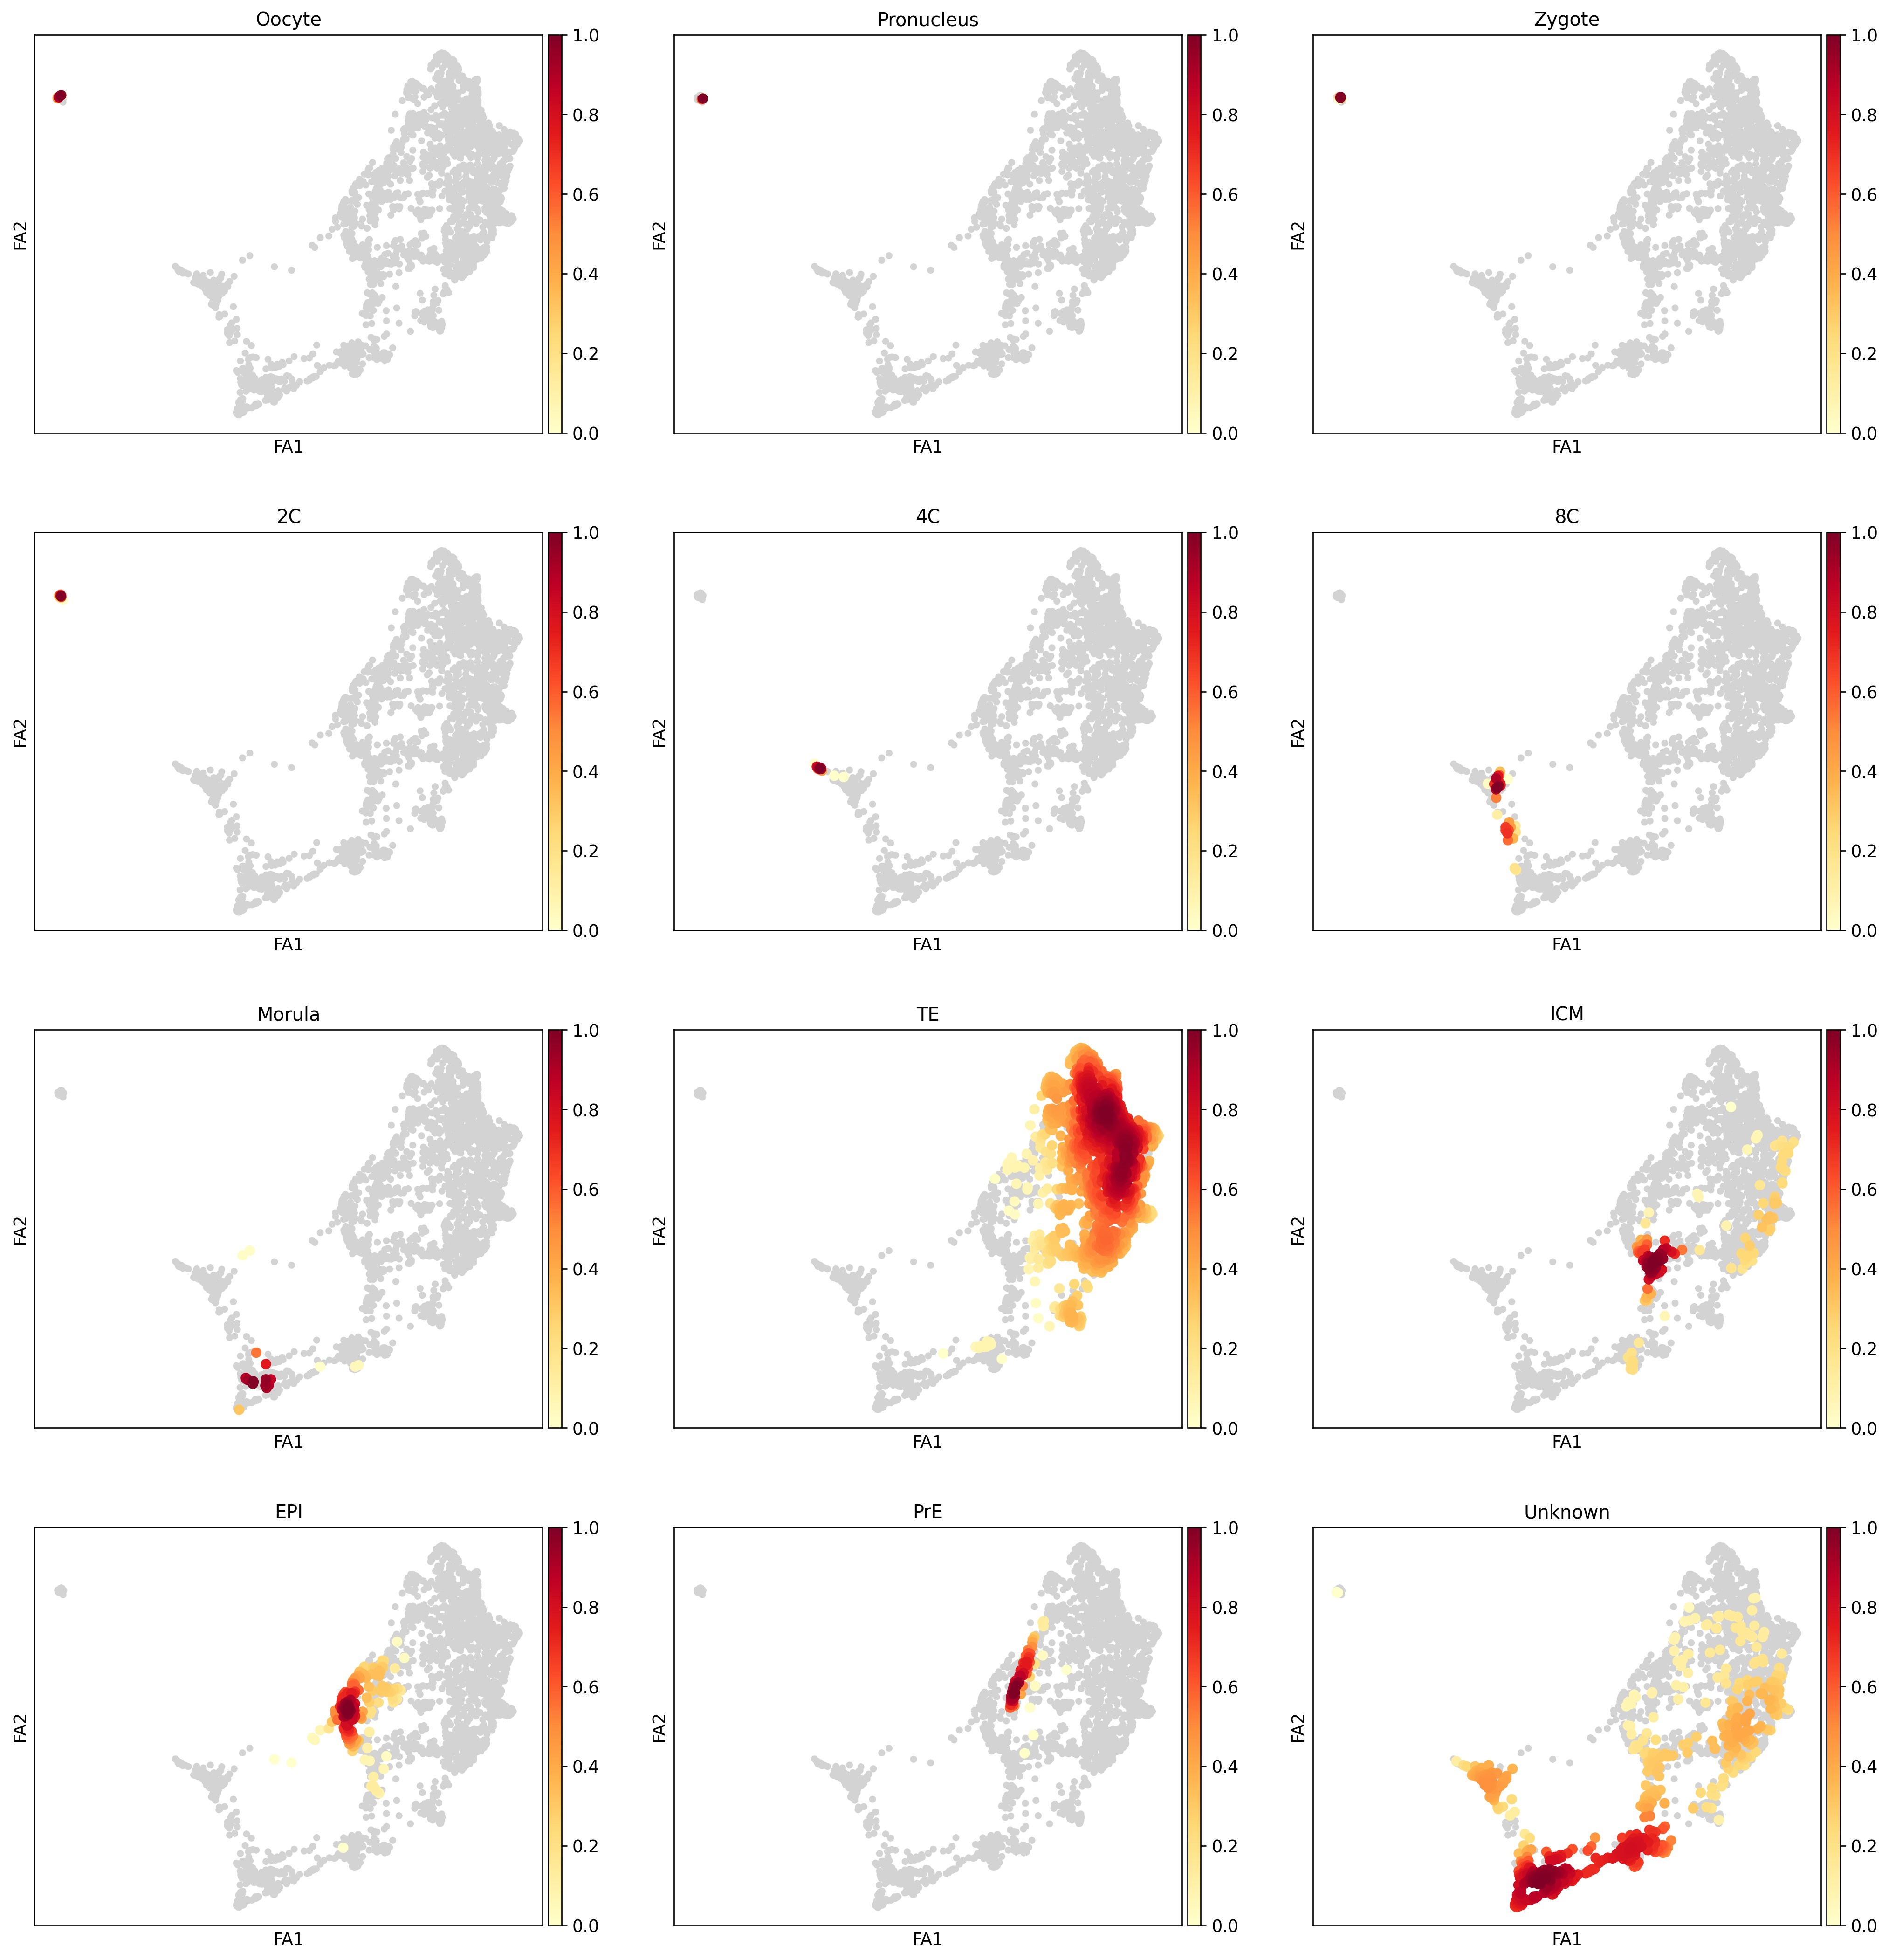
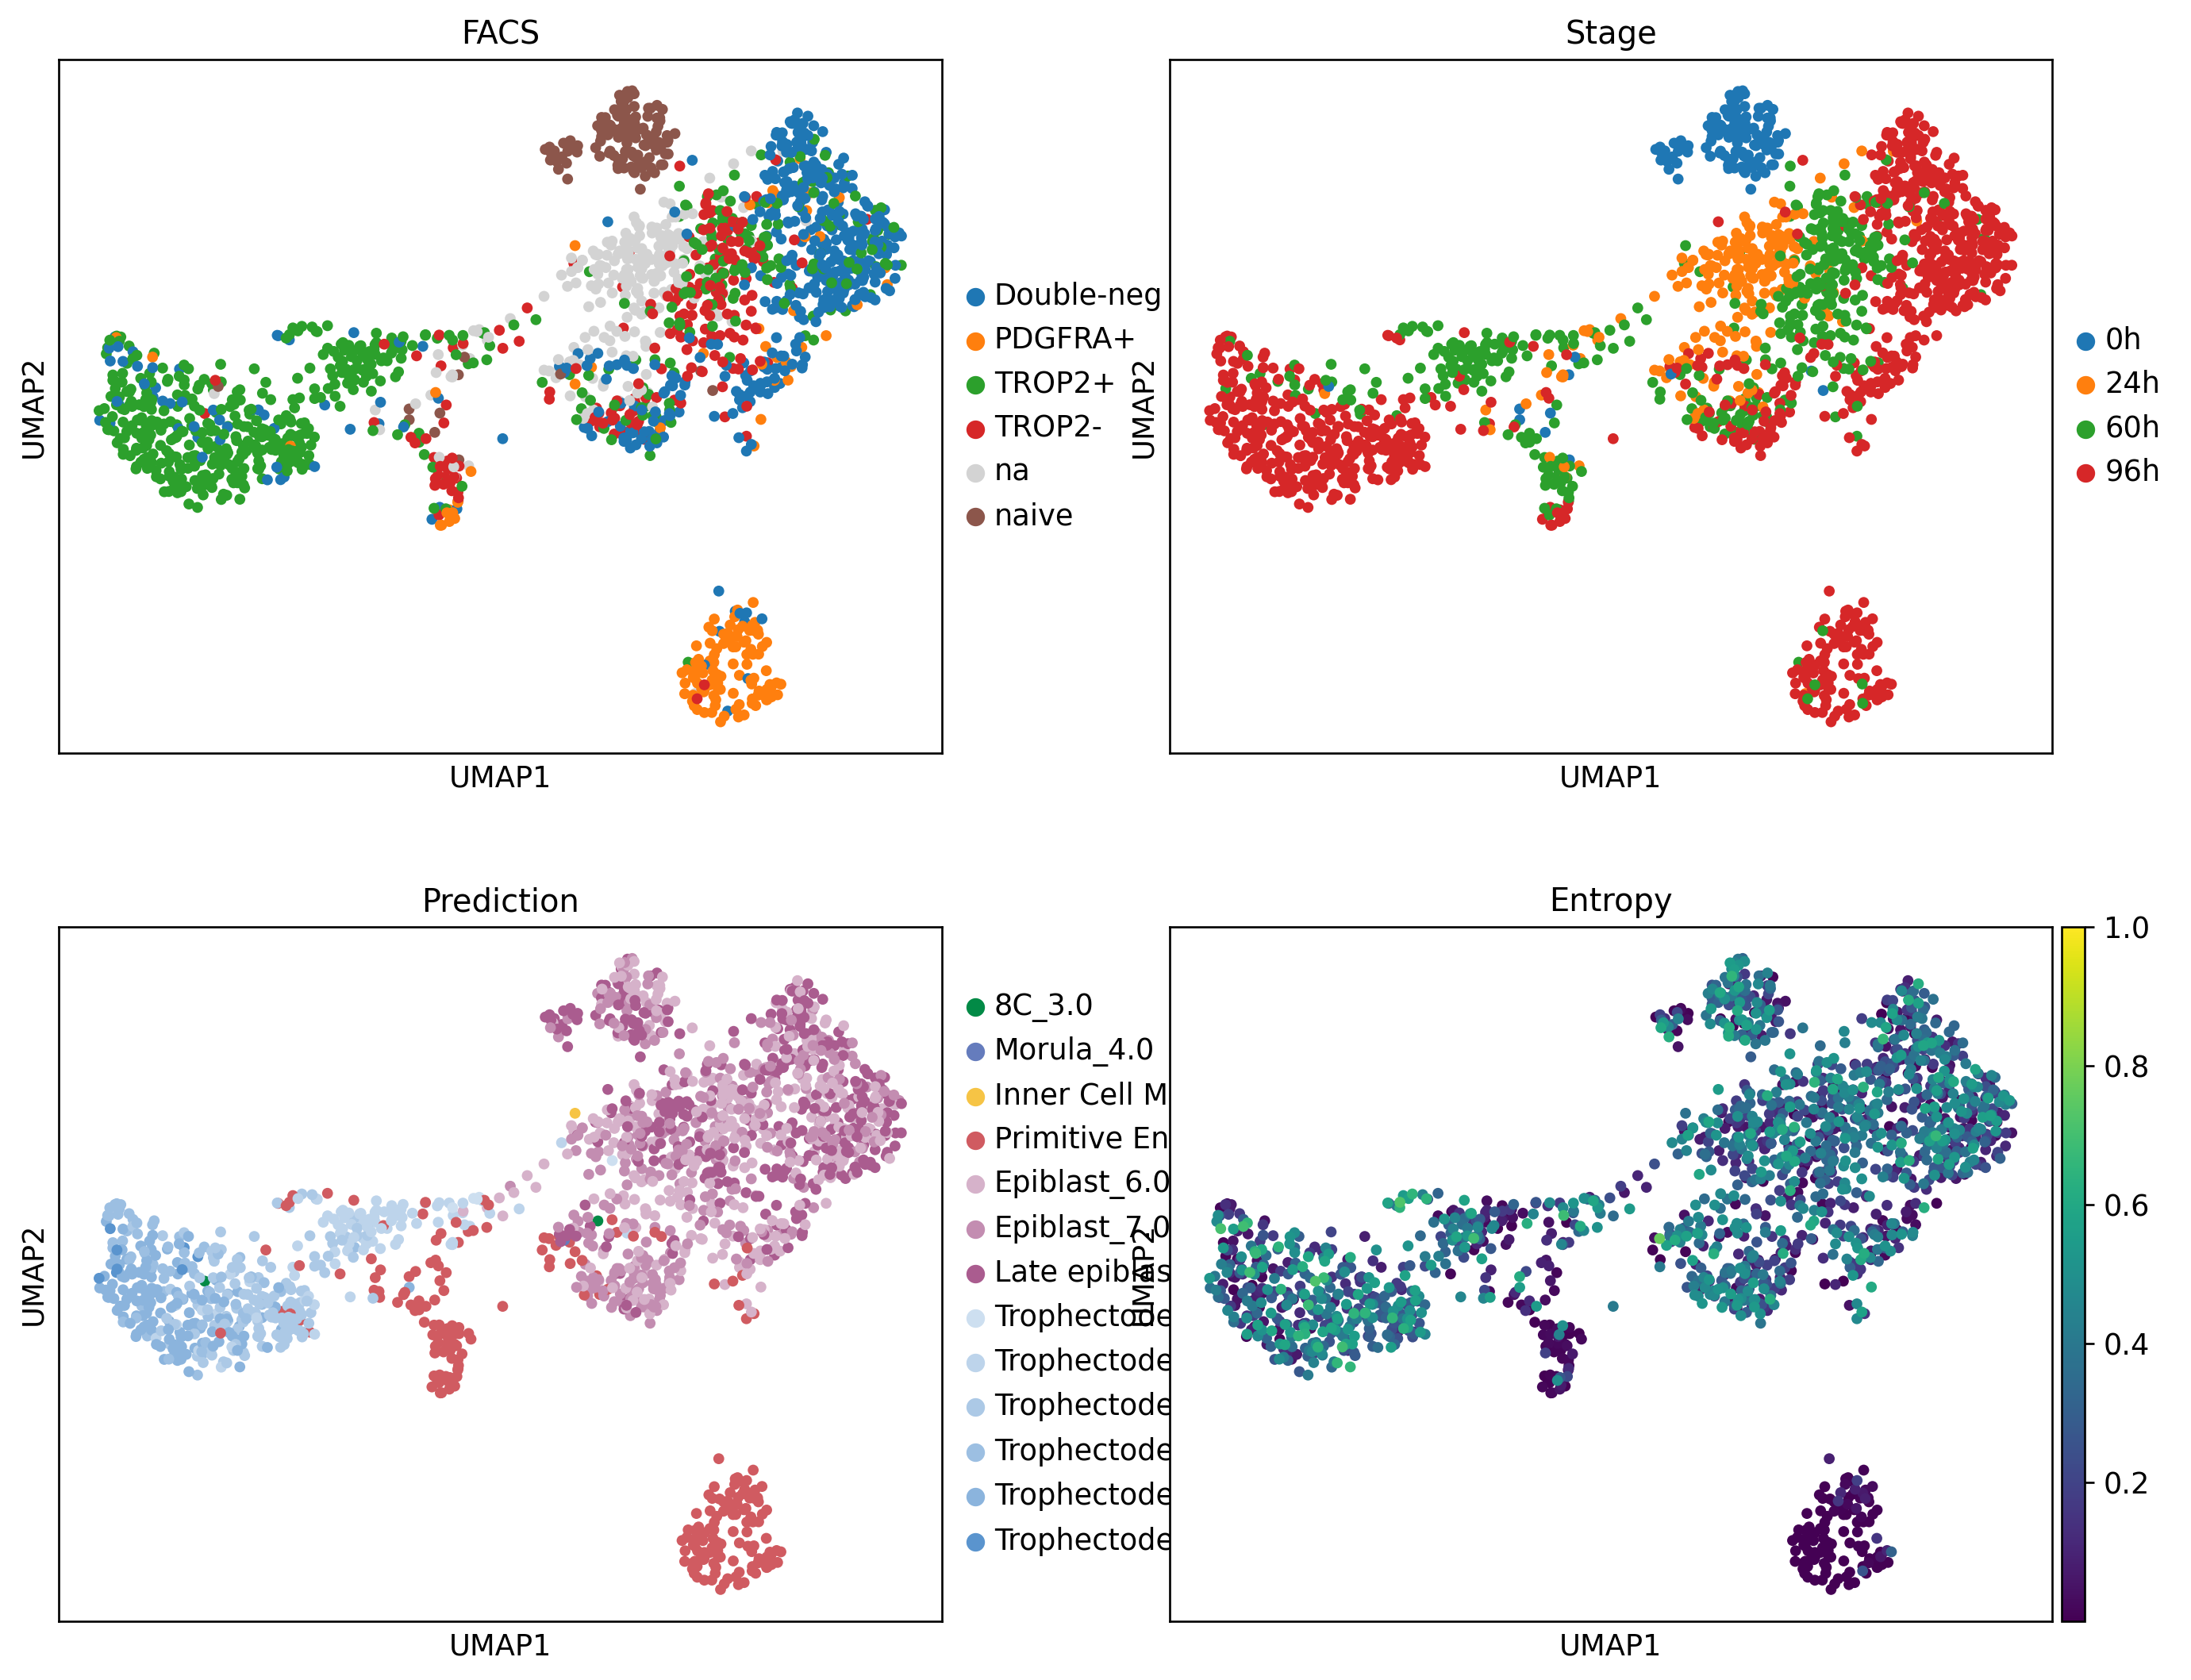
sc.pp.highly_variable_genes( query, flavor="seurat_v3", n_top_genes=5_000, layer="counts", batch_key="batch", subset=True,)sc.pp.neighbors(query)sc.tl.umap(query)query.obs.predictions = query.obs.predictions.astype('category')query.obs.predictions = query.obs.predictions.cat.reorder_categories([ct for ct in ct_colors if ct in query.obs.predictions.cat.categories], ordered=True)
WARNING: You’re trying to run this on 3000 dimensions of `.X`, if you really want this, set `use_rep='X'`.
         Falling back to preprocessing with `sc.pp.pca` and default params.
query.uns['flow_colors'] = ['#1f77b4', '#ff7f0e', '#2ca02c', '#d62728', '#D3D3D3', '#8c564b']query.uns['predictions_colors'] = [ct_colors[ct] for ct in query.obs.predictions.cat.categories]